
Posting a blog on Sunday, yeah…why not. This time posted from the beautiful city of Stockholm. I traveled to Stockholm to attend SQL Saturday Stockholm #851 this weekend as a speaker. Today, Sunday, I’m still here to do some sight seeing. So I wrote this blog post with the below shown view. Could be worse… right!

And now on with where it is all about… Dynamic visual titles in Power BI!
In the past, titles of you Power BI objects where static or in case you wanted to change them, this was only possible by using hierarchies on your axis. Power BI automatically changed the visual title by drilling in a hierarchy. This works fine, as long as you didn’t change it manually. Luckily this belongs to the past now! Since the April 2019 Power BI desktop update, it is possible to use DAX expressions to base your visual title on. Looking at this, it might be the first step to translations for Power BI and dynamically changing texts based on the users profile.
Dynamically change titles by using a hierarchy
As mentioned in the intro of this blog, it was already possible to change the title of your visual based on a hierarchy used in your chart. This actually worked fine, until you changed the title manually. From that point on, your title doesn’t change dynamically any longer. Since this is a known fact and there were no better options available, we’re not spending any more time on this functionality. 
Change titles based on a expression
Since the April 2019 update, it is possible to change the titles of your visuals based on a DAX expression. A really cool and much wanted feature if you ask me. So let’s start with a really basic example of how this works.
First of all, we must create a measure. Imagine that we have a slicer in our report to select the year. With that, we want to change the visual title dynamically. So, we do have a bar chart with the number of orders by category, and we do have a slicer for year. Knowing that, we want to change the title to “Number of orders by [selected year]” where we re-use the selected year from the slicer, or “Number of orders for multiple years” in case there is no year selected, or multiple years selected. We will start creating a measure for this.
Table Title step 1 =
VAR SelectedYear = SELECTEDVALUE('Values'[Year]; "multiple years")
RETURN
CONCATENATE("Number of orders for "; SelectedYear)
This measure first gets the selected year, but since SELECTEDVALUE can only return one result, we have an alternative result which is “multiple years”. To use this measure as our visual title, we open the format pane for the visual, go to title and over there we can right click in the title input field. In this input field you can select conditional formatting. With that you can select your just created DAX measure to be your title.

The next step
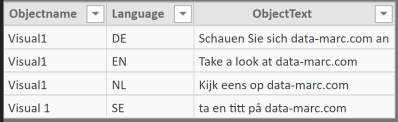
This is actually really cool! But we can take it to the next step. Now, let’s crate a visual title which includes a translation. In order to get this working, I first created a table including all possible titles for my visual, which looks like shown below. Since I want to base my translations on the logged-in user, I do have another table with the users and their preferred language.
Next up, creating a row level security role which results in only one row for our user table. This will help us to change this created relationship from many-to-many to a one-to-many relationship. With this we can actively filter our table with translations and create another measure. Probably I want to create a measure like this for multiple visualizations, so I added an object name in the translation table as well which I will use as a filter in my measure.
Object Title Language =
VAR UserPreferedLanguage =
    SELECTEDVALUE ( Users[Language]; "EN" )
RETURN
    CALCULATE (
        SELECTEDVALUE ( TableTranslations[ObjectText] );
        FILTER ( TableTranslations; TableTranslations[Language] = UserPreferedLanguage );
        TableTranslations[Objectname] = "Visual1"
    )
This measure first selects the user’s preferred language. In case there isn’t one, it returns English by default. Afterwards I get the selected object title from the table filtered on the preferred language, and the objectname. This results in a dynamically changing title!
Now, It’s time to see things working. So by switching the roles with row-level-security, I’m now able to change the language of this object dynamically!

To make it easier to understand how awesome this new functionality is, I’ve created a file which you can download here. This file will help you to reproduce and create your own dynamic object titles.

Very nice ! Interesting. Just hope this is not the “Microsoft final solution” for translation/multi-language support in Power BI…
LikeLiked by 1 person
Hi Alain,
Thanks for your reply. I don’t think this is the final solution. Since we’re still waiting for the final solution to come, this might be an interesting temporary solution.
LikeLike
some great ideas this gave me!
LikeLike
Hi Marc,
thanks for the post – it is a great way to manage European multi-language realities!
I implemented your suggestion on a large model with 68 visuals (storing the texts in a SQL database), but the bad surprise was that Power BI takes a lot of memory to store those 68 simple texts: DAX studio shows 1,1MB and event 14MB initially when the model is first generated. I had long discussions with Microsoft and they claimed that the 14MB is not real – they say that as soon as the model is saved and reopened, the data is compressed to the 1.1MB given later by DAX Studio. I have some doubts however that when decompressed in memory, the model still uses the 14MB for my 68 titles … which is quite crasy !!!
Do you have any idea on how to optimise this memory issue?
Thanks
LikeLike
Hi,
Your question is not really related to the dynamic titles, but more to optimizing the data model. Power BI compressed data on column level, more unique values = more memory usage.
Next thing you could do, is identifying your high consumers by using vertipaq analyzer. You can do this using DAX studio.
Hope this helps,
Marc
LikeLike
Hi Mark
thanks for the post!
I’m wondering how to apply the multi-language with multiple visuals?
do you have a solution for this?
Thanks a lot,
Sarah
LikeLike
Pingback: How to make your Power BI solution support multiple languages – Data – Marc