
In case you’re working in an international company, you might have to deal with multiple languages and cultures at the same time. As not in all countries and businesses, it is common that everyone speaks and communicates in English all day, it can be relevant to support other languages for your Power BI solution. But what do you do? Should you start duplicating your entire solution and translate all elements to a different language? Or develop your entire solution in the corporate native language, like Dutch or German?
In this post I will elaborate on using translations in Power BI, to automatically translate your Power BI model meta data to different cultures. Besides the meta data, I will also elaborate on aspects like visual titles and translating the data itself. Happy translating!

Why translating?
As I already shared during the introduction of this post, it might be that you have a requirement to support your Power BI solution in multiple languages. Recently, I came across this requirement more often. At one of my clients, there was a requirement to have the solution supported in Dutch, Flemish (Belgium), French and German.
First, I was hesitant to accept this new requirement, especially as the entire model from a platform and Power BI perspective are entirely build in English. I felt that everyone should just accept that the solution is entirely in English. At least in the Netherlands and in my experience, we work a lot with external parties and expats, meaning the main language is English. However, I learned that there are still many businesses still working in local languages, especially when you build solutions for local store managers for example, they work in a very localized setup.
So, I had to come back from my earlier statement. Translation really do matter and can make a difference in the adoptability of a solution. While exploring how translations work in Power BI, I came across various ways to implement meta data translations, where I elaborate on next.
What is there, and what is not with meta data translations
Once you start searching for translations in Power BI, there is tons of good content already available. So why am I writing this down again? Simply as I want to share my thoughts and experiences with it and try to complete a full picture, covering meta data translations, but also visual elements and data translations.
PBI Guy, aka Kristian Bubalo, put together a nice blog on how to do meta data translations using Tabular Editor 2. This was one of the inputs I used to go forward. Also, Kasper de Jonge, PM on the Power BI team, wrote in 2020 about translations for Power BI Premium also using Tabular Editor 2. With Tabular Editor 2, you are able to translate object names and descriptions, like table, column, measures etcetera. However, you have to do this using a text editor for every language individually by exporting and importing the translation file, as described in both blogs. You might wonder if there is an easier way to translate all this information in one go?
Alternatively, you can use something like the external tool Meta data translator, created by Kay Unkroth. This tool allows to automatically translate your model into multiple languages by making use of Azure translation services. I personally had some challenges in the beginning to get this translator working, but once I figured out via the community post of Greg Deckler which helped me to figure out how to get this thing working. It was mainly due to using the wrong keys and region coding. Below a small example how I got it working and with some of my findings.
I setup a simplified data model, containing a fact table and two dimensions. Notice nearly all column names are taken over as they are from the original source, being a SQL database. All column names are written in PascalCase. A few columns I’ve put underscores between the words, just to see how the translation service is handling that.
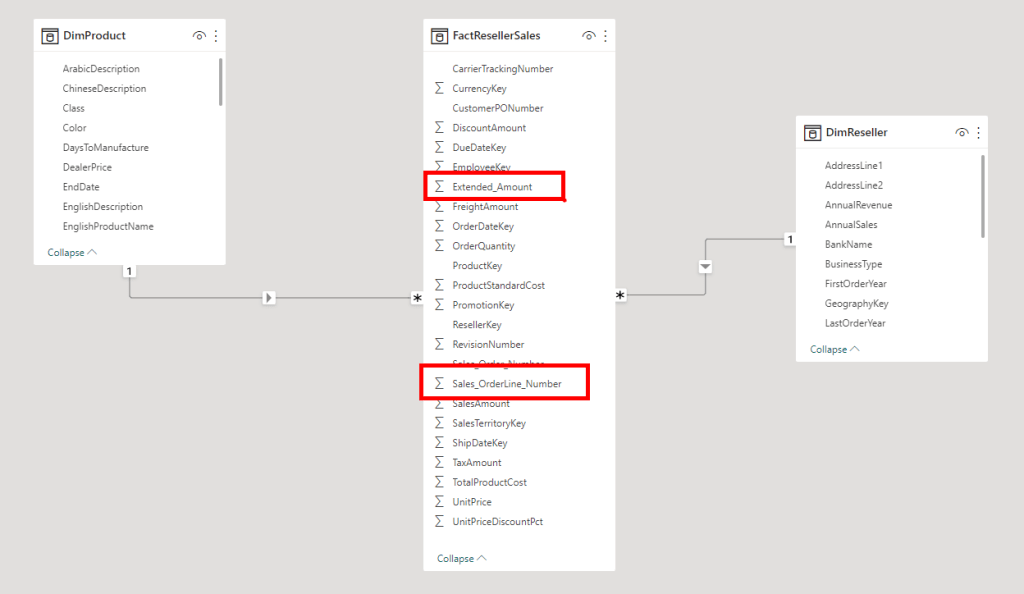
As a next step, we run the Metadata translator external too, and we add two more languages to the model, being Dutch and German. As Greg pointed out in his post mentioned above, we have to make sure we use the correct key, which we can find in the Keys and Endpoints section in the translation service in the Azure portal. By simply hitting the translate button, we will see that most metadata will be translated, even though it is in PascalCase. Though it is not fully accurate, as sometimes it does not know how to translate the full text, as highlighted in blue below. Also, notice the column names which had the underscores, they are not translated at all, highlighted in red.

The devil is in the details in this case. Personally, I’m always believing that data models should be built in the perspective of the end users that might use it in self-service scenarios. That means that all names and descriptions should be easy to read in normal language, avoiding technical naming conventions like camelCase, PascalCase or anything with dashes or underscores. It might very well be that your data source still uses PascalCase for example. Alex Powers put together a nice piece of PowerQuery code that helps you to directly convert all column names in a table to normal text, by adding a space at the place of each new uppercase letter. This avoids you having to rename all columns one by one. You can find this trick on GitHub here. Similarly, there is a way to split automatically based on a delimiter which you can do using this PowerQuery script.
Let’s see if the translation is more successful this time…

You can clearly see that the translations are much more accurate. Especially for Dutch speaking people, you can tell that it makes much more sense now. I truly believe that the Metadata translator is a super valuable tool, but only if your model has decent names for all objects already. However, make sure you still validate the translations before you apply them.
How about visual elements
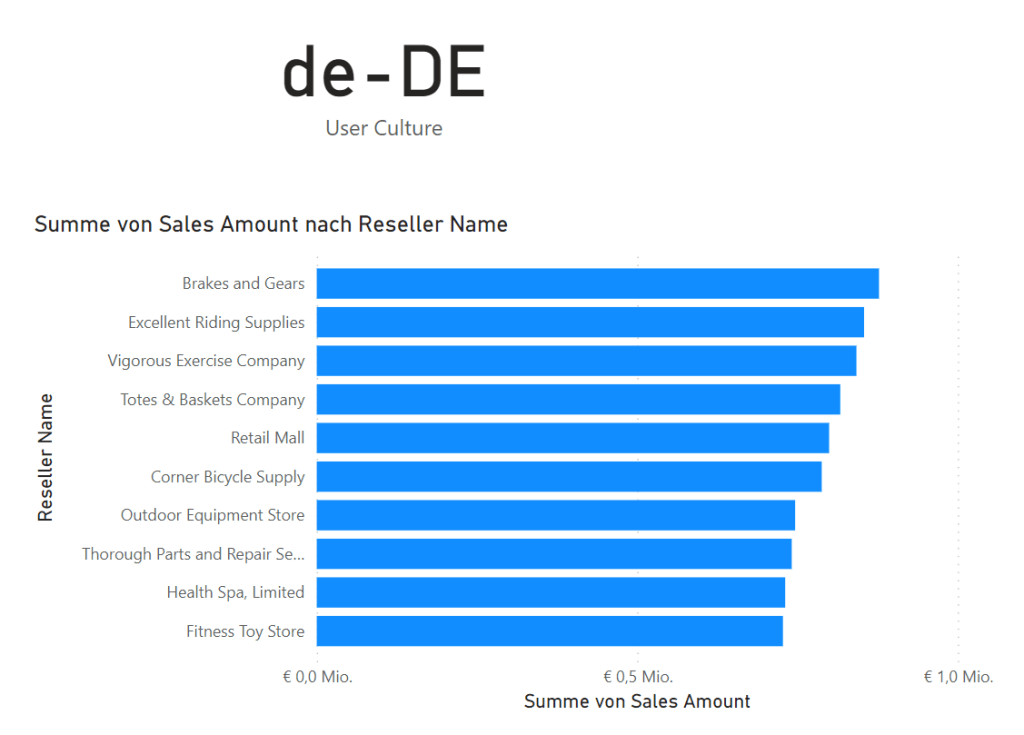
Using the approach described before, you will be able to translate all metadata, however this will not affect your report yet. By default all visualizations on your report get a visual title, which is a combination of all the metadata names. In below example you can see the title is Sum of Sales Amount by Reseller Name where you can directly see which items from the model are being used. With the default titles, the title will automatically be adjusted as soon as you change to a different language.

However, not in all cases the default title makes sense, and you might alter it. When you change the title, it will be hardcoded and will no longer automatically adjust based on user culture. By making your titles dynamic, you can overcome this challenge! Back in 2019, dynamic visual titles in Power BI were being introduced. I posted a blog on how you can setup a DAX expression of which the output can be used as a visual title.
If we take that one step further, we can use a specific DAX expression which picks-up the user culture and according to that we can specify the translated visual title. This DAX expression is USERCULTURE. You can test this by creating a simple DAX measure which will dynamically return the user culture.
User Culture = USERCULTURE()If you give it a try in the Power BI Service, you will notice that above measure in the card visual shows the current culture being German, also the visual title is dynamically adjusted. This is still the default title generated by Power BI.
Once you start using the DAX expression for USERCULTURE, be aware that it is only effective if you apply it in measures if you want it to work dynamically. As measures are calculated on report rendering in CPU, while DAX calculated tables and columns are being rendered at data refresh. Therefore, it would not make sense to have anything dynamic like this in a calculate table or column. Further, please know that this is only supported using Power BI Premium.
Let’s pick the same example visual as used above, and now make sure that the visual title is also dynamically changing to German and Dutch, just like the metadata of the model. We can do that by specifying a simple DAX expression like below:
Dynamic visual title =
  SWITCH(
      USERCULTURE(),
      "de-DE", "Gesamtumsatz nach Wiederverkäufer",
      "nl-NL", "Totale verkopen per reseller",
      "en-US", "Total sales by Reseller"
  )
Once we configured the visual title to use the outcome of this measure, we will notice that the visual title is also adjusting automatically, as well as the name of the visual axis which are based on the column names.

Data translations
When we look at the data itself, we still have a challenge to solve. So far, we only looked at translations of the metadata, like tables, columns, measures etcetera. However, we did not look at the data itself, where if you have a product table with the product “Bike” will still be called “Bike” for all languages.
Though, there is a way to also translate the data inside the model. Chris Webb wrote a nice blog post on how you can achieve this by making use of composite models in Power BI. The way described by Chris basically means that you require to have a column in the tables for each supported language. As a result, your tables will be wider and containing far more columns if you want to support a hand full of languages. Without going into too much detail, wide tables are not optimal for Power BI and will drastically increase the model size, which will have its own side effects. Read more about that in Paul Turley his blog where he elaborates why you should not have big wide tables in Power BI.
Is there another way to deal with data translations? Well yes but is a far from ideal solution unfortunately. Instead of making the table wider, you can also make the table longer. The translation of textual values should apply to your dimension tables only, since your fact tables should ideally contain numeric information mostly and keys to the dimensions. Let’s say, you have a total of 5 product categories in a dimension table, where you want to support three languages. As a solution, you add the translation for each the two additional languages on the rows, which makes your dimension now exist of 15 rows. In this scenario there are two things that can happen.
- You use the same id/key for the dimension value for each language. Meaning with the above example your relationship between dimension and fact will change from a 1:M into a 3:M, as you have 3 records with the same id/key. As a result, your relationship will become many-to-many with all possible performance and potential ambiguity implications that come with it.
- You generate an additional surrogate key for each language, to which your relationship will remain 1:M. In order to make sure the right language is picked up, you need to introduce additional columns on the many-side of the relationship in the fact, where you link to the ids/keys of the other languages. So, for each language you get a separate key column and you create an active relationship based on the default language. Next to that, you create inactive relationships for each additional language. In order to select the right relationship to be used, you include the DAX expression USERELATIONSHIP in each measure, so only relevant rows from the dimension table will be show. You can even consider including this logic in a calculation group, where you apply a report-level filter to select the right language. As a side effect, your model becomes more complex to use for self-service purposes.
- A last option I can think of, would be row level security, where you filter out the right values on the dimension tables based on a user culture, which then filters down to the relevant data. You can achieve this with the USERCULTURE function. This approach can be applied to both above scenarios, but requires to have row level security applied to all dimensions.
In the last two scenarios your DAX complexity goes up which might have performance impact. This makes me conclude that data translations are not yet doable in a sustainable, manageable and performant way.
Wrap up
Let’s start with reflecting on my own standpoint I had earlier. Having everything in English is still the preferred way to go for me, though I have to admit that supporting languages is important for inclusiveness to everyone, especially for self-service models it can make a big difference for the adoptability of the data model.
At the same time, adding translations also brings additional maintenance work. Like every new measure, column, table or other object has to be translated once it is added to the model. Especially with an ever-evolving solution this can bring additional work to the table. Automatic translations with the Metadata translator will definitely make your life easier and help a lot! Nevertheless, you have to keep in mind to match all criteria up front before you start translating the model in an automated fashion and still validate the outcomes. The cost of the Azure translator service is not to mention. There is even a free subscription, but even the paid ones are really affordable. Finally, it is also a pity that it is only supported for Power BI Premium at this point, where I would love this to be available to a broader audience.
Coming to a final point of data translations, you might have to ask yourself if you really want to go that route. In all fairness, I’m not a fan of the approaches I’ve written down above. It brings so much complexity to your model and at the same time has many side effects like performance implications. If you can, I would aim to have the data in English as much as you could. For some dimensions though, it would be useful to work with a translated set of data, like product names and/or categories. Typically for customer dimensions or anything in that order, it does not make any sense to translate the data.
After all, I learned a lot myself in figuring all this out, as it was a feature I never used before. Not all I figured out myself, but used valuable resources as referenced to in this blog. As a final note, if you are looking for an example file, you can find the pbix file I used on my GitHub with Power BI examples.

Pingback: Multi-Language Support for Power BI – Curated SQL
Pingback: How to make your Power BI solution support multiple languages - Everything Power BI