
Lately, I published the first out of two blogs about monitoring your on-premises data gateway. The first blog was all about monitoring your gateway up time but doesn’t tell you when one of the connections on your gateway is down. This blog will go in more detail how you can monitor your data source connectivity on the gateway.
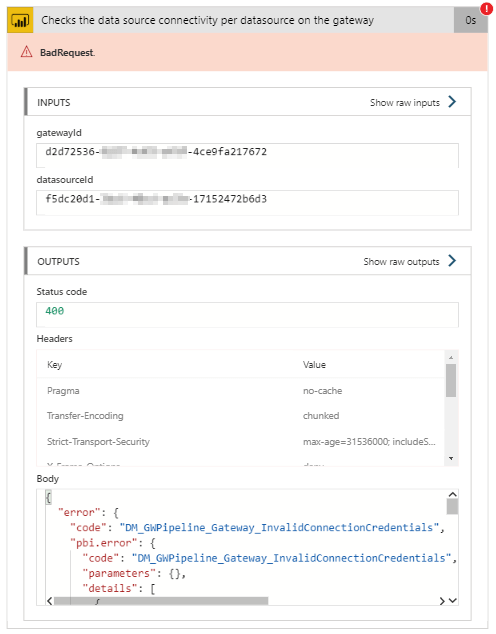
First of all, we continue with the solution where we finished after the first blog. Below once again the architecture of this solution. In this blog we will use exactly the same setup and enrich it with a second streaming dataset and report in Power BI. Besides that, we will also create a second custom log, in the Log Analytics workspace to save the results of our data source connectivity for long term analysis. 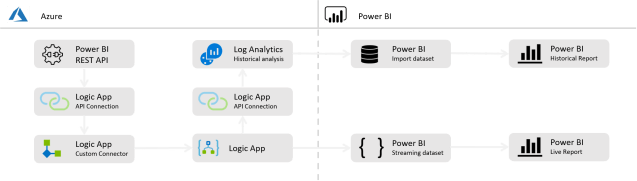
Jumping in here? I advise you to read the first blog on this topic, before you continue.
1. Logic App – part 1 – Parallel branch
Identical to what was pointed out in the first blog, we don’t want a hard-coded solution, with hard coded gateway ids. We want to make it as dynamic as possible. Therefore, we keep the first step as is, to get all gateways. The result of this step was that we get a list of all gateways where we also parsed the JSON. After that we add a parallel branch to split the following steps in two ways that run at the same time.

Now we can apply new steps, in parallel to the For Each loop we created before. Next step we need to take, is to add an action from the Logic App Custom connector, that gets data from the Power BI REST API. Here we use the action Returns a list of datasources from the specified gateway. Because again, we can have multiple gateways as result from the first steps, we need to apply this step in a For Each loop.
Let’s run the Logic App now to see what our result is so far. The resulting JSON object might look like the below example:
{
  "@odata.context": "http://wabi-north-europe-redirect.analysis.windows.net/v1.0/myorg/$metadata#gatewayDatasources",
  "value": [
    {
      "id": "33bb14b6e934-4fdd-6542-8852-1f69e798",
      "gatewayId": "1f69e798-5852-4fdd-ab01-33bb14b6e934",
      "datasourceType": "Sql",
      "connectionDetails": "[YourConnectionStringHere]",
      "credentialType": "Basic",
      "credentialDetails": {
        "useEndUserOAuth2Credentials": false
      },
      "datasourceName": "SQL Test"
    }
  ]
}
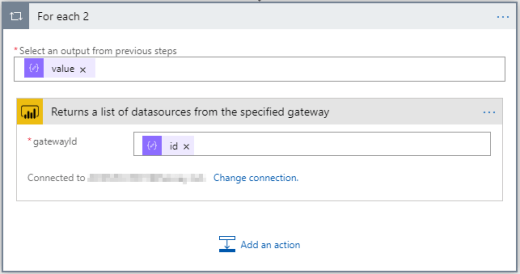
Because the above result does not tell us anything yet about the status of the data source, we need to add another step. Since we want to re-use parts of the above returned JSON object, we first Parse the resulting JSON again.
The next step we want to do, is to capture the connectivity status of the Gateway data source. Because of that we add another action, that again fires an API call to the Power BI REST API. The name of the step we must apply is Checks the connectivity status of the specified datasource from the specified gateway. Here we insert two results of the previously parsed JSON, which are the GatewayId and the DataSourceId.
By assigning the right inputs to the newly added action, there will automatically appear another For Each loop. Since we can have multiple data sources assigned to one gateway, we create another loop here.
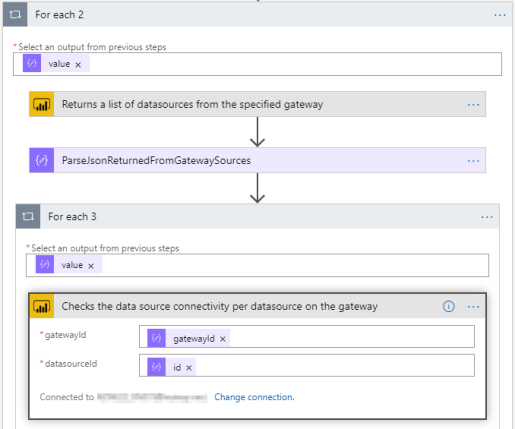
Let’s perform another run now, to see what our result is so far. If you are lucky, you have a successful run, without any errors and all runs in the For Each loop return status 200. If you are not, you will have some failures as a result like I have in the below screenshot. Actually, the failures are what we want to capture! These failures tell us that one or more data sources are not connected or any other kind of error.
If something like the above happens, we want to capture this, notify responsible persons and save for long term analysis. Since we don’t know exactly what error might be returned, we cannot re-use the body of the above error as sample load for the Parse JSON step we must add next. Therefore, we use the sample response provided in the documentation.
{
    "error": {
      "code": "DM_GWPipeline_Client_GatewayUnreachable",
      "pbi.error": {
        "code": "DM_GWPipeline_Client_GatewayUnreachable",
        "parameters": {},
        "details": [],
        "exceptionCulprit": 1
      }
    }
}
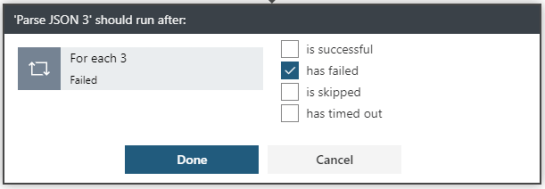
After adding another Parse JSON step based on above sample load, we have all object separately again. Another thing we want to set in the logic app, is to only run this step when the action for the data source connectivity failed. We can easily change the Run After setting by clicking on the ellipsis on the right top of the Parse JSON action. Here we change the settings to only run after the previous step has failed.
Once this is done, there are a few more steps to take to get the data in a Power BI streaming dataset, as well as saving it for long term analysis.
2. Create another Power BI streaming dataset
In the first blog about gateway monitoring, there was a description on how to setup your Power BI streaming dataset. This time, we want to setup another streaming dataset but this time only for the data source connectivity. Without going in to all the details on how to setup a Power BI streaming dataset, below the setup I used to push the Logic App results to Power BI.

Since we set the Run After properties to only run when the result returned is a failure, this dataset will only include data when there is a failure logged on the data source connectivity in the gateway. With that, we take the assumption that the data source is online when it does not return an error.
3. Logic App – part 2 – Push the data to Power BI
The last parts we need to cover, is to push the data from the Logic App to the Power BI streaming dataset again. Since this is a repeat of steps that was done in the first blog, the description below will only include what it should look like, other than describing them all in detail.
The first thing we need to setup, is another action, which is Compose to create a JSON object matching the format expected by the Power BI streaming dataset. The compose step might look like below, based upon the fields you want to push to the streaming dataset. You can also re-use content provided in earlier Parse operations in this compose step. For example, to fill in the gateway name.

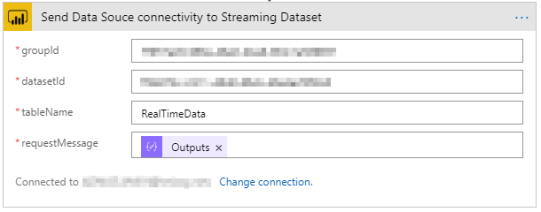
The step we need to take afterwards, is to feed the resulting JSON object of the Compose operation in the Power BI streaming dataset. Therefor we will use another action from the Power BI REST API custom connector. Again, the default table name is RealTimeData. The action in the custom connector we will use here, is named: Adds new data rows to the specified table, within the specified dataset, from the specified workspace.
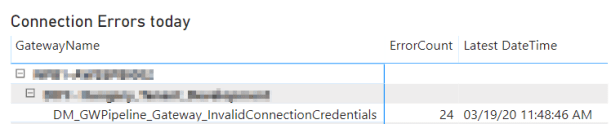
After running the Logic App for one or multiple times, we receive the data in the Power BI streaming dataset, where we can build a report on top of that. In below example I created a simple table that shows the gateway name, connection name and the error code in a matrix, including how many times this same issue is flagged in the last 24 hours and the last time it was seen.
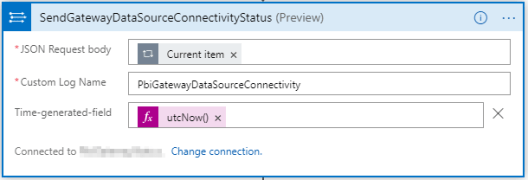
Last but not least, we can save this data again in Azure Log Analytics for long term analysis. If we want to do this, we can simply add a final step in the For Each loop, to also push this data to Log Analytics.
Wrap up and remarks
All by all, this can be a complex setup to monitor your gateways, where a lot of different components are needed. On the bottom of this blog, I have included a final overview of the Logic App setup that I have used to build this end-to-end solution. However, there are some things you might want to do differently.
- In the setup I have used, I created two separate Power BI streaming datasets to push the data through. Since there is no option available to composite these two datasets in Power BI, we need to create two separate reports on top. By doing that, we are limited in Power BI functionality. You may consider adding some more complexity to the Logic App by combining both results from the Gateway availability as well as the data source connectivity into one dataset and pushed to one Power BI streaming dataset.
- Not comfortable with all the Azure components used? Know that there is a (preview) option to manage your on-premises data gateways by using PowerShell. Find more about that in this blog post. The operations below operations might cover similar information:
– Get-DataGatewayClusterStatus– Get-DataGatewayClusterDatasourceStatus - This solution will only tell you something about the availability of the gateway and underlying data sources. One thing that is missing, is the performance of the gateway server. Therefore, you can consider to user the example as Patrick Leblanc explains be below video, to also stream CPU and Memory usage to Power BI.
Last but not least, the final overview of the gateway where the setup of the first blogpost and this one are combined in one solution.


Pingback: Monitor your On-premises data gateway with Azure and Power BI – Part 1 – Gateway up-time – Data – Marc