
Imagine that you are building a Power BI dataset for corporate reporting, that will also be reused for self-service purposes by many others. It is up to you, as dataset author, to make it as simple as possible for them to reuse your content and avoid misunderstandings.
In this blog I will give more detail about dataset reuse and how you can spice up your data model to take the dataset reuse scenario to the next level for self-service purposes.
Dataset reuse use cases and advantages
There are many different use cases to consider where shared datasets can be an advantage. Below I have quickly listed a few advantages, but probably you can think of many more.
- Centrally managed definitions and calculations to avoid different calculations for the same metrics and different versions of the truth.
- One central load from source to Power BI dataset, which lowers the performance impact on the source system.
- Easier to kickstart the data driven analytics experience for the business users and any other self-service analytics purposes.
Where you should think about for dataset reuse
Reusing one centrally managed dataset has many advantages as mentioned above, but there are a few things you should be aware of to make it a success story.
Permissions for dataset reuse
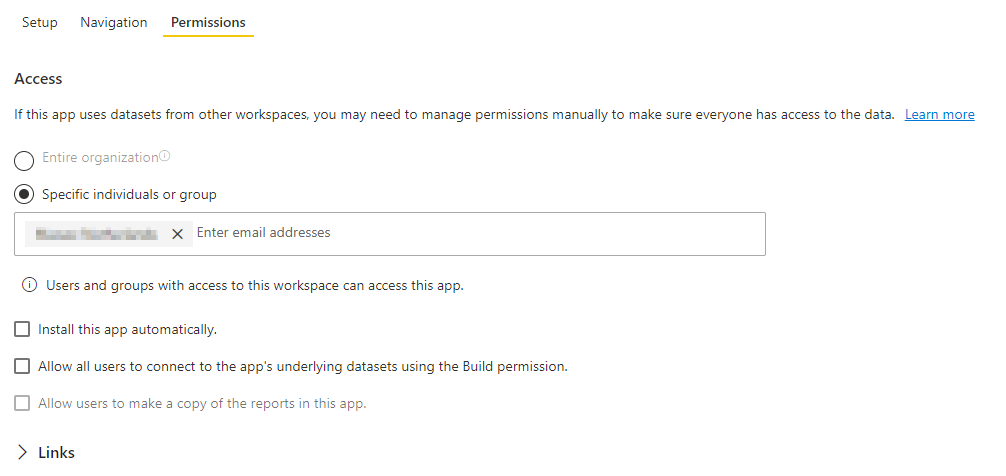
If you allow others to reuse your dataset in Power BI, this can be done in many different ways. By publishing a Power BI App, you can allow others to copy the dataset to another workspace for reuse or allow them directly to connect to the dataset from Power BI Desktop if they have sufficient build permissions on workspace level. This all can be managed through App settings. Read more about the app settings in the docs.
Another option you have to give the right permissions, is to grant access on workspace level. At a minimum, contributor permissions are needed before others can connect to your data model via Power BI desktop or another workspace. Also take licensing into account here. A Pro license is needed for publishing content to the Power BI service.
Clarity
Besides only granting access, providing a clean data model that is easy to understand is maybe even more important. You do not want your uses to accidentally use the wrong table or column or let them struggle to find the right items. You want to make it as easy as possible for them to work with your dataset.
Naming
The first thing you need to do, is give everything an explanatory name. When you import your data from a SQL database, or any other source system usually means that names do not include spaces but are written in camelCase or PascalCase. This is not the most user-friendly way to display your table and column names.
Please start with renaming all your tables and columns in the Query Editor before you load them in your data model. You can do that all one-by-one which is really time consuming. But luckily the community found an easier way to do this. Alex Powers shared a trick to automatically beautify all column names in Power Query by using a function. He shared his trick on his GitHub page.
Naming of tables and columns is one thing, but please also implement some easy naming convention to every additional object you create, such as measures and columns. This can be easily done by using prefixes and suffixes for every measure you create. For example, use an indicator for the value type as prefix and any time and/or aggregation related context as suffix. This will automatically list all similar items together in the fields pane.
Let’s say we want to create a measure for our Sales and want to that also in Year to Date and Previous Year to date.
| Metric | Measure according to naming convention |
|---|---|
| Sales | $ Sales |
| Sales year to date | $ Sales YTD |
| Sales previous year to date | $ Sales PYTD |
Hide irrelevant content
Make sure that you hide everything that is not relevant. Hide all tables and columns that are not required for them to use. You can easily do that in the model view by clicking the item you want to hide and switch the toggle in the Properties pane or right-click it in the Fields pane.
By hiding columns, please also hide all fields used on the many side of the relationships you have defined in your model. Dataset consumers can create new (report-level) measures on top of your dataset. You want to avoid that they do a count on the many side of a relationship for example. Or even better, provide them already with these measures pre-defined so they do not have to create additional measures. All additionally created report level measures will not be pushed down to your dataset.
Descriptions
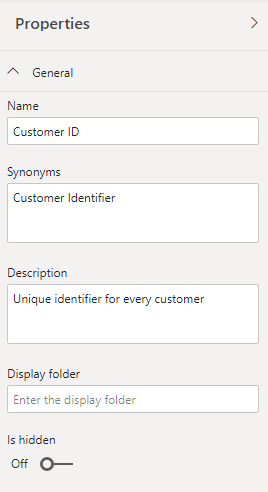
Also add a description to every item that might be used by the ones leveraging your data model. This can be a measure, column, complete table or any other item that might need explanation. This can also be done in the Properties pane in the model view of Power BI desktop. This might be useful in a later stage if you want to generate data model documentation using Dynamic Management Views (Spoiler, more about that later in another blog post).
Display folders
Last but not least, you might also want to group specific content together in the fields pane. For example, group all your Sales related metrics in a folder. This is possible by using the Display Folders in the model view. Here you can also multi-select (use CTRL) measures or columns and bulk-edit the properties such as the display folder.
It is even possible to create sub-folders. You can do this by using a backslash in the display folder field. But think about it before you do this to avoid too many folders.
Spice up the table names
Earlier I mentioned that naming of your tables and columns is the first thing you should care about. I started this blog already mentioning to spice up your data model for reuse. For this section I’m more than happy to give all credits to Tristan Malherbe and Jean-Pierre Riehl.
Today Tristan pointed out a nice thing in Power BI to beautify your table names even more. Power BI accepts Emojis as table and column names, which makes it even fancier and faster to understand where the specific table is about. You can easily do this by pressing the Windows button and the dot on your keyboard (WIN + . )
As said, all kudos to Tristan and Jean-Pierre! Follow them and give him a shout out on Twitter to let him know how cool this is! Below his tweet including an example screenshot.
Twitter Jean-Pierre: @djeepy1
Twitter Tristan: @Datatouille

Pingback: Sharing a Dataset in Power BI – Curated SQL
Pingback: Power BI Governance – Why you should consider to disable Export to Excel – Data – Marc