Power BI includes a very rich set of data connectors to get your data from. Both connectors to on-premises and cloud solutions are provided which sometimes require an On-premises data gateway in order to refresh your dataset in the Power BI service. This additional component, does not have out-of-the box monitoring functionality. But why not set this up yourself? As a Power BI administrator, you want to know when your gateway is down, even before your users start complaining that the gateway is not reachable. With the solution described in this blogpost, you can setup your own on-premises data gateway monitor.
The end-to-end solution will be described in two blogs. This first blog will go into detail about monitoring the gateway up-time, where the second part will also address monitoring of individual data sources on the gateway and connectivity status.
The on-premises data gateway
As mentioned in the introduction of this blog, Power BI has a rich set of data connectors. Depending on the fact if this data source is on-premises, in a different cloud or in Azure, you might need to setup a gateway in order to automatically refresh your dataset or dataflow in the Power BI service. The on-premises data gateway acts as a bridge to access and transfer the data from the hosting location to the Power BI service.
The Power BI on-premises data gateway is not only related to Power BI. This gateway can be used by many other Microsoft services such as Power Automate, Power Apps, Azure Analysis Services and Azure Logic Apps.
Guy in a Cube recently posted a video about getting started with the Power BI gateway as well. Adam Saxton is currently posting a series of videos on the on-premises gateway. Find the series of videos here.
More about the On-premises data gateway can be found in the Microsoft documentation.
Solution overview
As owner of the Power BI gateway, we want to know if the gateway is available, but also if all connections on our gateway are still up and running. This first part of this diptych will describe how to monitor your gateway up-time, where the second part will describe how to monitor the data source connectivity status.
In order to monitor our gateway(s), we need a few different components,
- Obviously, a configured on-premises data gateway, we need to monitor something.
- Admin access to the on-premises data gateway, in order to get access to the gateway itself and see the configuration of the gateway.
- Power BI REST API, we will use the Power BI REST API to get insights available.
- Azure subscription, for billing of the consumed Azure resources.
- Azure Resource Group, one logical place to group your resources together in Azure, you can compare it with a Power BI workspace.
- Azure Logic App, will be used to call the Power BI REST API and send the data to the Power BI Streaming dataset.
- Power BI Streaming Dataset, for continuous sending and analyzing data in Power BI, without limitations in data refreshes.
- Optional: Azure Log Analytics, to save the data for future analysis.
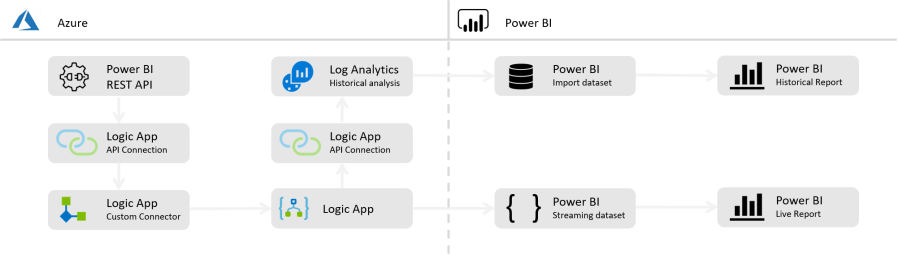
Based on all the above components, the below solution architecture is used. Of course, there are some decisions made. Below an explanation on the different components that are considered and chosen.
Logic Apps or Power Automate?
One of the key components in this solution, is the way how we call the Power BI REST API and push the data to the storage layer. There are a few low/no-code options we can choose from. Power Automate, as part of the Power Platform or Logic Apps, as part of the Azure cloud platform. Based on the technology you feel confident with, you can choose one or another.
Not familiar with Power Automate or Logic Apps, the difference and which one works best for you? Check out this blog by Nagaraja Emmadisetty.
I choose to use Azure Logic Apps, because I do not only want to have real-time gateway monitoring, but also want to save the data for long-term analysis on Azure Storage. Since a Logic App is an Azure Component, the platform integration is easier setup and handled by Microsoft.
Another reason to choose for Logic Apps over Power Automate is licensing. Power Automate requires a more expensive license to work with Premium connectors, what custom connector in Power Automate are.
Power BI REST API custom connector
No matter if you choose to use Power Automate or Logic Apps, in both scenarios you can create custom HTTPS calls to the Power BI API. But that will result in repeating steps multiple times. As described in my earlier blog about centrally managing your Power BI refresh schedules, I used an Power Automate custom connector setup.
For the setup in both Power Automate and Logic Apps, we can use the same custom connector. The custom connector can help to keep our flows simple and clean and re-use API calls in different flows as well. Ida Bergum, wrote a great blog on creating a custom connector.
Saving or streaming the data?
In the setup below, the data will be streamed to a Power BI streaming dataset, since we want to have this data available (near) real time. By using the streaming dataset, we are not dependent on scheduled refreshes in Power BI. With that we do not have a limitation of 8 refreshes a day in a Pro license and 48 in premium, but we can push the data in the Power BI dataset more often. The recurrence of pushing data in the streaming dataset, is something you can configure yourself in the Logic App or Power Automate flow.
Since this Streaming dataset will grow over time, you might want to limit the time kept in the streaming dataset and store the historical data somewhere else for trend and long-term analysis. In order to do that, you can optionally also write the data to the type of storage you prefer. In the case described, I send the data to a Log Analytics workspace.
Setup the Gateway monitor
Before you can start setting up your own custom gateway monitor, you need to make sure that a few components are in place, such as Registering an Azure subscription, create an Azure resource group and set up the Azure Logic Apps custom connector for the Power BI REST API. After these three components are in place, we can continue to setup our Gateway monitoring solution.
Remark: Operations (triggers, actions, …) inside a Logic App do not accept names with a . (dot) or , (comma) or any other special mark. The names used in the custom connector do have a . (dot) at the end of the name by default. Take into account that you need to change that manually. If one of the special marks is used in the name, the Logic App does not save.
1. Logic App – part 1 – Get the gateway status
As first step, we start setting up an Azure Logic app. The first decision we need to make, is on what recurrence we want to check the gateway status. In my example, I chose to check the gateway status every 30 minutes.

Once the recurrence is set, we can add the first action. Here we will use the custom connector which is created up front. The API call we will do, is based on the API call to get all gateways for which the user is an admin.

The result of this API call can be a list of multiple gateways and must look like what is available in the documentation and shown below.
{
   "value": [
        {
            "id": "1f69e798-5852-4fdd-ab01-33bb14b6e934",
            "name": "My_Sample_Gateway",
            "type": "Resource",
            "publicKey": {
                "exponent": "AQAB",
                "modulus": "o6j2....cLk="
            }
        }
    ]
}
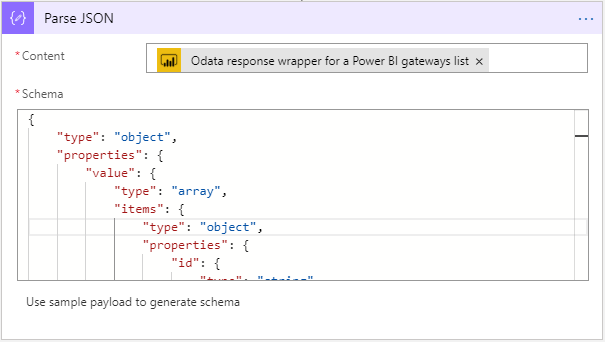
The result returned is a JSON object, including all the gateways the user doing the API call has access to. This result includes a Gateway Id, which we need to use in a later stage. In order to re-use only the Gateway Id, we want to parse this JSON object, so all information returned will become available as separate objects. We can do this by adding the Data Operation Parse JSON. As input field, we use the response of the previous step. We also need to define the schema of the JSON. Click on the button Use sample payload to generate schema and paste the sample payload from the API documentation.
Now, we only know which gateways we have access to, but we don’t know anything yet about the gateway status. Therefor we need to do an API call per gateway, to get more details about one specific gateway. But we must do one other thing first.
The Logic App does not know what the result looks like at this moment after we parsed the JSON. First thing now, is to save and run the Logic App once, so we can directly check if everything works as expected. Once done, we can continue to add the next API call.
The next step is to get more details about our gateways we want to monitor. This can be done by the API call named Returns the specified gateway. This API call requires the Gateway Id as an input field. Since the result of above steps may return multiple gateways, we need to do this in a For Each loop, so we can perform this action for every Gateway we have. So, first we add the For Each loop, before we can do the API call. The input for this loop is the complete Value object returned from the Parse JSON action.

As you can see in above screenshot, we can add new actions in the For Each loop. Here we will call the next API named Returns the specified gateway. In this action we can insert the field Id which is returned from the Parse JSON action.

The result of this step is another JSON object, per gateway. This includes the gateway status and should look something like the below.
{
   "@odata.context": "http://wabi-north-europe-redirect.analysis.windows.net/v1.0/myorg/$metadata#gateways/$entity",
   "id": "1f69e798-5852-4fdd-ab01-33bb14b6e934",
   "gatewayId": 0,
   "name": "My_Sample_Gateway",
   "type": "Resource",
      "publicKey": {
      "exponent": "AQAB",
      "modulus": "o6j2....cLk="
      },
   "gatewayAnnotation": "{\"gatewayContactInformation\":[\"Username@mailadress.com\"],\"gatewayVersion\":\"3000.9.194+ga90bb05c0e\",\"gatewayWitnessString\":\"{\\\"EncryptedResult\\\":\\\"",\\\"IV\\\":\\\"EncryptionGuid",\\\"Signature\\\":\\\"SignatureGuid"}\",\"gatewayMachine\":\"GatewayServerName"}",
   "gatewayStatus": "Live"
}
As you can see, the result is very similar to what we already had before, but we now also have a Gateway Status, which was missing in the previous result.
It might look like an overkill, since the above result is very similar to what we already had. You can consider to directly do the last API call if you know the gateway Id, but this will be a hard-coded setup and not dynamic. The setup described above will first get all the gateways, so we can dynamically call the last API to get the gateway status for each gateway.
For now, save the logic app. Later, you need to add a few more steps to the Logic App. We first need to setup our Power BI streaming dataset before we can push the data to Power BI.
2. Create a Power BI Streaming Dataset
In the above section is described how we can get the data available about our gateways. Since we want to have a (near) real time monitoring of our gateways, we don’t want to be dependent on Power BI data refreshes but want to have the data directly available. Therefor we will use a Power BI streaming dataset, which makes it possible to push data in the dataset via API, without triggering a dataset refresh.
 A streaming dataset can be created inside a Power BI workspace by clicking the + icon on the right top. In this first dialog, we choose for an API based streaming dataset. In the next screen, we need to set the field we want to write to this streaming dataset. Now, we should have a quick look back at the last result returned in our Logic App, which included the Gateway Status.
Probably, you do not want to push all the items to the streaming dataset. You can choose yourself which information you want to push to the streaming dataset. I chose to send the Gateway Id, Gateway Name, Status and a DateTime stamp.
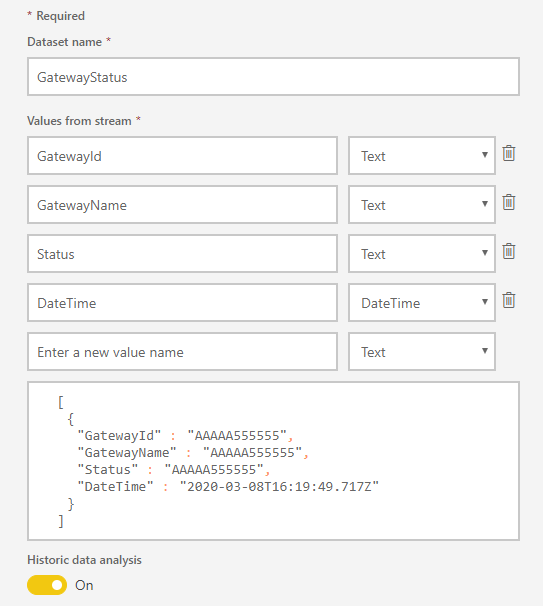
I also checked the option to save historical data analysis. If you do not check this option, every row of data pushed, will overwrite the existing row of data. Not enabling this option, will result in issues when you have multiple gateways. Since the gateway status is requested per gateway in the For Each loop in the Logic App, the data will also be pushed to the Streaming Dataset per gateway.
After you have created your streaming dataset, temporarily save the sample JSON provided by Power BI in a notepad. We need this in the second part of the Logic App setup.
[
  {
    "GatewayId":"AAAAA555555",
    "GatewayName":"AAAAA555555",
    "Status":"AAAAA555555",
    "DateTime":"2020-03-08T16:22:46.537Z"
  }
]
3. Logic App – part 2 – Push the data to Power BI
Now we have a Streaming Dataset in Power BI, we can push the data in the dataset with some more steps in the Logic App. The final JSON object what was provided by Power BI, is exactly the format what Power BI expects the data to receive. Therefore, we need to make sure that we create JSON object in the Logic App with exactly this structure. All steps described below, need to be done inside the For Each loop that is created earlier.
The JSON schema, does not exactly match the schema returned from our last API call. We only want a limited set of columns to push to Power BI. Since we need only a limited set, we first want to Parse the JSON again, like what is done after the first API call. The Data Operation Parse JSON is needed to do so. This needs to be done inside the For Each loop.

After parsing the result, all columns are available separately. Now we can create the a new JSON object as the Power BI Streaming Dataset expects it to receive. This can be done by adding another Data Operation named Compose.
In the input field of the Compose step, the JSON provided by Power BI can be pasted. Next, we must edit the JSON to be dynamically filled with the response from the Parse JSON operations done before.

Since there is no DateTime field in the returned result from the API call, we can generate this during the run by using a dynamic expression. The expression utcNow will return the UTC time at moment of the Logic App run.
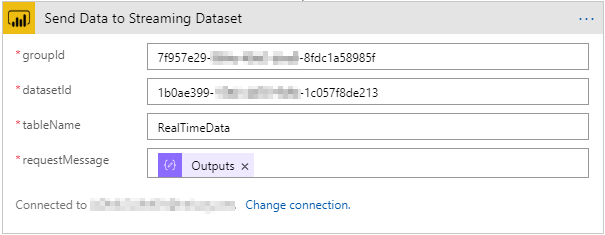
Now the JSON is created according to the schema, the final thing to do is sending the data to the Power BI Streaming Dataset. Therefor another API call in the custom connector is used. The operation used for this, is named Adds new data rows to the specified table, within the specified dataset, from the specified workspace. There is one other operation similar to the one suggested, which pushes the data in a dataset in My Workspace. Please always use the option suggested above, to make the solution more dynamic.
In this operation, all input fields need to be defined.
- groupId: insert here your workspace Id
- datasetId: insert here your dataset Id
- tableName: by default this is RealTimeData.
- requestMessage: insert here the output from the Compose step.
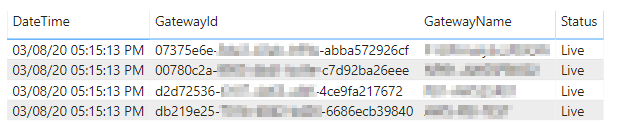
This is the last step that needs to be done, in order to push the data to the Power BI Streaming Dataset. Now, it is time to Save and Run the Logic App again. As a result, you can see the data pushed in the Power BI Streaming Dataset and report. Now, it is up to you to create a stunning report on top.
4. Save the data to Log Analytics (optional)
As mentioned earlier, you can optionally also save the data to an Azure Log Analytics Workspace. Therefor you need to add one more step in the For Each loop in the Logic App. A few steps are needed to make this happen:
- Create a Log Analytics Workspace inside your Azure Resource Group
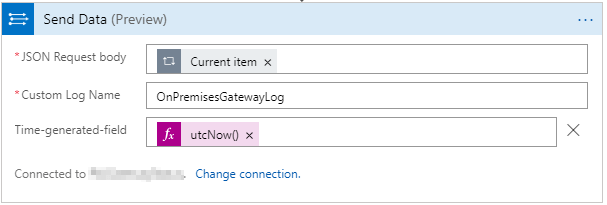
- Add another action to the For Each loop, where you add the operation Send Data (preview) as part of the Azure Log Analytics Data Collector.
- First time, it will ask you to create a connection with the Log Analytics Workspace. As a result, there will be a new API Connection created inside your Azure Resource group.
As soon as the above three steps are done, we need to configure which data will be send to the Log Analytics Workspace. The following fields need to be defined:
- JSON Request Body: insert the Current item object here, as part of the For Each loop.
- Custom Log Name: inside the Log Analytics Workspace, a new custom log will be created. The name can be freely entered at your own choice.
For example: OnPremisesGatewayLog - After clicking the button Add new parameter a Time-generated-field can be added. Advised is to do so, to make sure you have an insert timestamp in the Log Analytics Workspace as well. Like what we had with the Compose step, there is no DateTime field in the result of the API call. Therefor we add a dynamic expression here as well.
Wrap-up and remarks
With building the above solution, you can fairly easy create your own On-Premises Gateway Monitor. This will help you in tracking when your gateway is down, even before the users of the Gateway will know it. From an admin perspective, this can be important to pro-actively inform your users if the gateway is down.
Some of the components in above solution can easily be tweaked according to your own preferences. Such as the recurrence you use to run the Logic App and whether you want to save the data for future analysis, not even speaking about the storage of your own choice.
One important thing to take into account, is the limitation of the Power BI REST API. We’re not even close to the limit, but together with other processes, you might reach the limits. The Power BI REST API allows 200 requests per hour at maximum.
Now, we can monitor the availability of the gateway itself, there is still one thing missing. As you may know, a gateway can have multiple connections, to a variety of data sources. All these connections on the gateway include credentials that may expire over time. Because of that, you might want to monitor the gateway source connectivity as well. In follow-up of this blog, I will post a part 2, which includes monitoring on data source connectivity on the gateway(s).
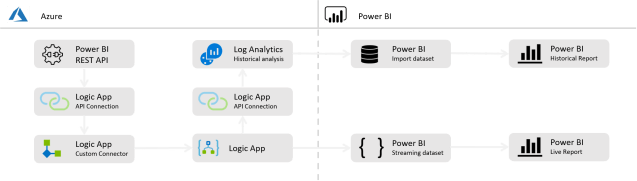
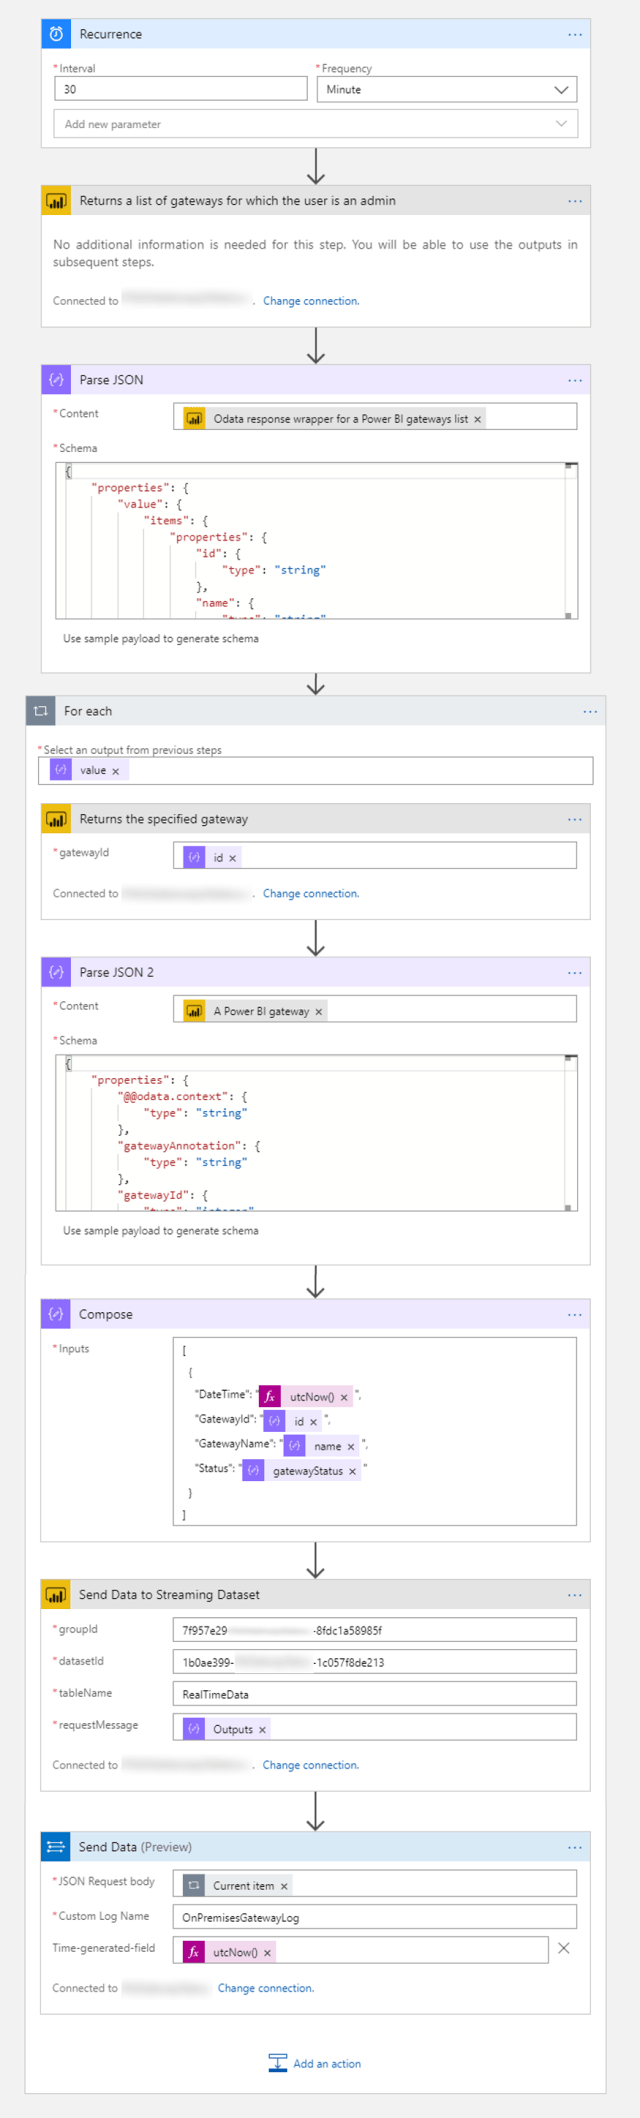
Finally, below and end-to-end overview of the Logic App and all components.

Pingback: Monitor your On-premises data gateway with Azure and Power BI – Part 2 – Data source connectivity – Data – Marc
Pingback: Unable to open or download Power BI report, because link to Azure Analysis Services is gone. What now? – Data – Marc
Unfortunately, this API call has nothing to do with the health of the gateway.
The gateway admin page may say “partially online” even when you decided to disable some of the cluster members on purpose. It may also say “online” despite the fact that a cluster member may be misbehaving, leading to random request errors.
LikeLike
Hi Harrie,
That’s correct. If you had the impression this post talked about the health of the gateway, that is not the intention. It’s all around if the gateway can be reached, making sure there is an active connection between Power BI and the gateway service. It won’t tell you anything about performance. Also, what I described in part 2 of the gateway monitoring blog – will just tell you that the gateway has a working connection to a source, credentials didn’t expire etcetera. Again, nothing to do with the performance of the connection. Everything with regards to performance, load etcetera can only be monitored on the gateway itself through the logs and is highly depended on the gateway machine configuration – therefore it is something outside the influence of Power BI, but has everything to do with the server management.
–Marc
LikeLike
Looks like the link to the set up the Azure Logic Apps custom connector is broken. Can you provide an updated one
LikeLike