
Two blog posts in one week? Yeah… why not! Simply because I’m really enthusiastic about new functionality that is just released, I decided to grab my laptop and immediately write a blog about it!
The drill through functionality is in Power BI for a long time and already made huge steps forward. Though, one of the most challenging things with this very valuable feature was the discoverability. Hidden behind the right-click, not every user was able to use this feature or not even know that it is there. Let me take you through the biggest game-changers for drill through in Power BI and close-off with the recently launched (preview) feature in the March 2020 release!
Drill through introduction
As said, drill through is a functionality which is in Power BI for a while. To be honest, I can’t find when exactly it was introduced to Power BI, but it is a powerful feature, especially for a fully interactive report experience and a great storytelling feature in Power BI.
The drill through functionality allows you to easily drill to another page, by taking the context of the specific record where you applied the drill through, as a filter to another page. On the other page, you can create another stunning report, full of insights and stunning visuals to show more deep-dive insights, still with that specific filter applied. But before you can do so, the report author needs to define which fields in your dataset you allow to be used for this drill through functionality.
The easiest setup, as described above, allows you to drill through another page in the same report. But it can be more extensive! As of the April 2019 Power BI release, it is also possible to perform a cross-report drill through. This new option allows you to drill to different reports in the same workspace, if they have a shared dimension. Cross report drill through was a very welcome addition, especially working with large audiences and different levels of granularity in your data. As an example, you can easily grant access to the top-level report for a wider audience, but the more detailed pages are only accessible for a limited group of people. Though… it was still not very much used because the feature was still hidden behind the right click.
Read more about how you can setup drill through in the Microsoft documentation.
Next steps in discoverability
As mentioned above, the drill through functionality has come a long way! There are some interesting improvements made in the past, which helped very well in making the drill through better discoverable and more used.
Right Click
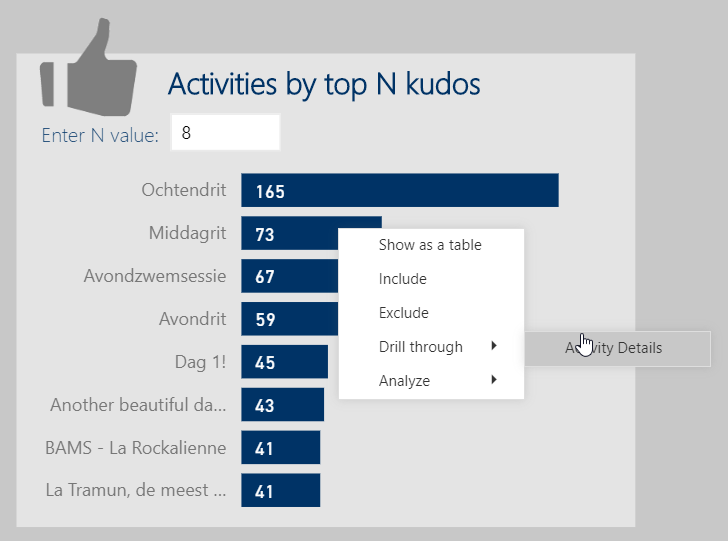 For a long time, the drill through functionality was hidden behind the right mouse click in Power BI. The report consumer needed to do a right click on a visual in order to drill through (navigate through) the other page. Since this functionality was very hidden, it was a very hard for a report consumer to know where the drill through could be performed, without right clicking every single visual on the page. As a result, the functionality was hardly used.
Quick win in discoverability
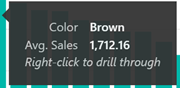 After a while, there was a new improvement, which was more of a quick win to make the drill through functionality easier to find and let the report audience know that they can perform a drill through on that specific visual. The addition that was done, was to show the text Right click to drill through in the tooltip of that visual. All though it was a very good next step, there were still some challenges. If you start using a report page tooltip, this additional piece of information is gone and it will be up to the report author to get creative and inform the report consumer that the drill through can be applied on that visual.
Inform users about drill through in a tooltip
After Ignite 2019 a very interesting video was posted by Guy in a Cube. Patrick Leblanc, showed us how you can use a report page tooltip in order to inform your user with a dynamic GIF image that the drill through functionality can be performed on that visual. Check out below video to see how you can create one!
Great feature right! Really intuitive way of showing your report consumers how they can interact with the visual and perform a drill through. Though, it kills the flexibility to have a report page tooltip to show other information.
Drill through buttons!
The March 2020 release for Power BI was a huge one! Lots of awesome features are released, including a preview of drill through buttons. To my opinion, this is a massive step forward in the discoverability of drill through! Now, it will be much easier for report consumers to see that they can drill through more details. All though it is still in preview, the functionality works smoothly!
After you added a button to your canvas, there are a few properties you need to set in order to get this working.
- Type of action, set this to Drill Through (Preview)
- Destination, select the page you want the button to navigate to.
- Enabled tooltip (optional): Hover over text if the button is enabled.
- Disabled tooltip (optional): Hover over text if the button is disabled.
By default, the button is grayed-out, until you select an item in one of the other visuals. Based upon your selection, the button will be activated. My advice is to use the textual tooltips, so you can easily inform your report consumers what they need to do in order to activate the button.
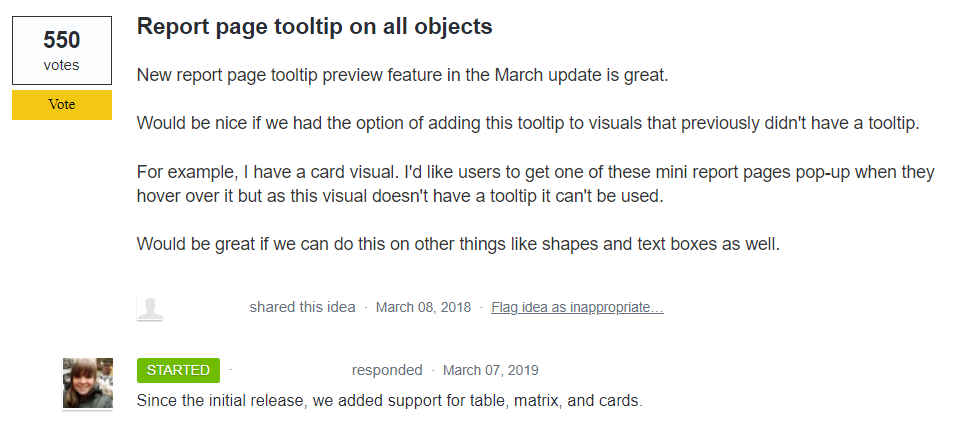
Another great step forward would be to have custom report page tooltips enabled on buttons, so we can combine the earlier mentioned functionality with GIF images and drill through button! This will be another great step forward in making drill through more user friendly. Luckily, there is already an idea listed on the ideas forum for this, but even better, it already has the status started!

Pingback: Jump from one Power BI report to another by using cross-report drill through – Data – Marc