
I can’t be more excited! After the first time I heard about Microsoft Fabric, it directly took my interest. Especially as I see this as a nice bridge in which the worlds of Power BI and Data Engineering will come closer together. Something, that triggers me to broaden my horizon, and I think it will for many others!
Though, coming from a Power BI world, it might also scare you. All these new artifacts and new workloads… should I start learning new skills? Subscribe for a Python course? Learn how to build data integration pipelines or write Spark notebooks? In this blog I will write down my thoughts about Microsoft Fabric looking from a Power BI developer perspective.
Microsoft Fabric, what are you talking about?
It might have slipped through your LinkedIn or Twitter timeline, but I think it would be pretty hard to have missed the announcement of Microsoft Fabric, the new kid on the block. Fabric is the new SaaSification of many workloads we already know and love in the world of Azure Data. It’s an interface in which we can start using Azure Synapse workloads like data warehousing, data lakes, but also Data Factory workloads by building pipelines and using SQL endpoints which we know from SQL Serverless. All of this comes together in a Power BI like interface, in which we can start consuming all these different workloads in a Power BI Premium-like capacity-based pricing model.
Further, I won’t repeat what many others have already said. I happily refer to the official announcement of Microsoft Fabric on the Microsoft blog. Also, recommend watching below 15-minute video from Microsoft Mechanics in which Justyna Lucznik explains all ins and outs of Microsoft Fabric.
Scary?
All this new stuff might scare you, if you’re coming from a Power BI world. All this new stuff comes very close to the area of Power BI with concepts like workspaces and capacities. Matthew Roche – Program Manager at Microsoft also wrote an excellent blog in which he highlights some of the similarities between Power BI and Fabric.
Besides the familiar concepts, there are also many new things that are not known in the world of Power BI. This might freak you out at this early point in time, so quickly after the release. Should you become a full stack BI developer now covering all different workloads? Should you start learning Python, writing Spark notebooks and building pipelines?
The short answer is: NO. I’ve wondered this too, when I first heard about Fabric. While being super excited at the same time, given I was lurking for new options to broaden my skillset outside Power BI. At the same time, I don’t consider myself as a data engineer. Also, I have zero knowledge on any coding language like Python.
During the MVP Summit, mid-April 2023, I had an extensive conversation with some Program Managers that work on Fabric, discussing different angles to look at Fabric and how to position it for typical Power BI folks and how it relates to all other roles. Based on these conversations, I’ve formed my own vision and conclusion.
Approach it as an opportunity!
When we look at the end-to-end workflow, from collecting data from various data sources, to saving it in the OneLake that comes with Fabric, up to building a data model out of it and finally visualizing, there are many familiar areas where every Power BI developer can get started right now! Therefore, I rather approach Fabric as a massive opportunity to span my wings across multiple workloads with tools that I’m familiar with.
Let me elaborate on each of the elements and where the familiar areas are:
Data Ingestion
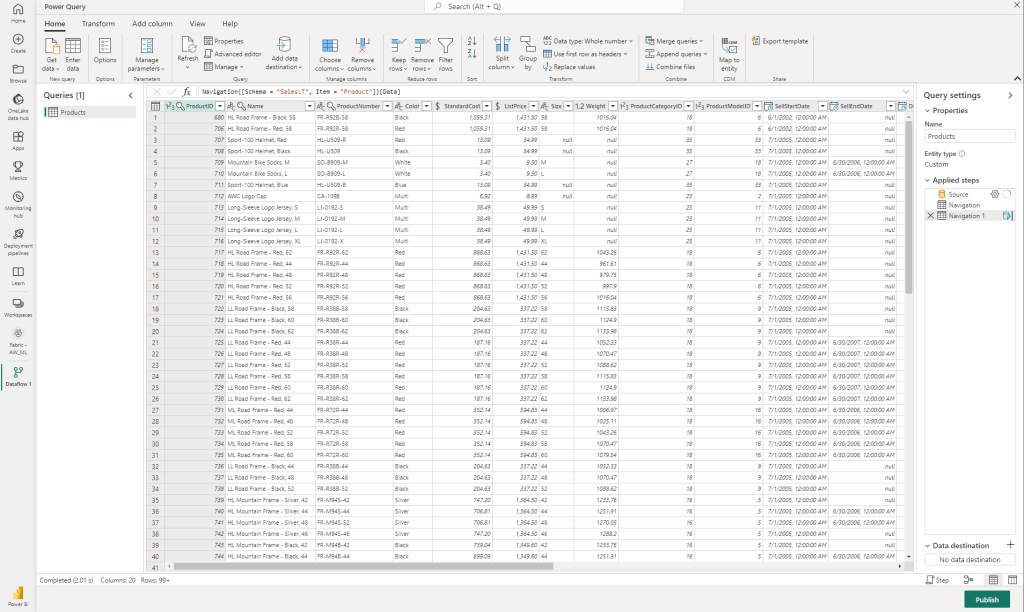
When you connect to your data sources to ingest data, there are many ways in which you can make this happen in Fabric. For example, you can start using Spark notebooks or pipelines. But coming from a Power BI world, this might be unknown. Instead, you can start using dataflows gen2 to ingest your data, which will be saved in the right format on your OneLake. All transformation can directly be done in the interface you recognize from any other dataflow you’ve built before.
On demand querying
When you successfully published one or multiple dataflows and refreshed them, you will see multiple other artifacts appearing in your workspace. One of them, is the SQL Endpoint artifact. When you open that, you can start writing on-demand SQL queries and save them as views. Alternatively, you can start building visual queries, in which you see familiarity with the diagram view of dataflows. But above, all, this interface has many similarities with what we know from Power BI Datamarts – and therefore a comfortable area to work in for Power BI folks.

Data modeling
From the same interface in the SQL Endpoint as we just had, you will notice a very small button on the left bottom, which says Model. This is the button which directs you to the data model view which we know from Power BI Desktop and recently also from Power BI web modeling. In this interface, we can directly start building relationships between various tables, introduce new measures and more.
The data model we produce here, will be automatically saved within the same workspace as default dataset. So, all changes made will be directly applicable to all connected artifacts. If, for whatever reason, you want to have various separate datasets, you can easily create a new dataset as well with the buttons in the top ribbon in the reporting section. Again, all familiar interfaces for Power BI folks!
The datasets built in this way via the cloud interface, benefit from the new storage mode Direct Lake. This storage mode is intended to only have one copy of your data in OneLake and therefore avoids data duplication and data refreshes redundant. Though, you still see a refresh button, which solely refreshes the meta data of your data model and looks after the delta logs to see if any new data has come in at OneLake.

Data visualization
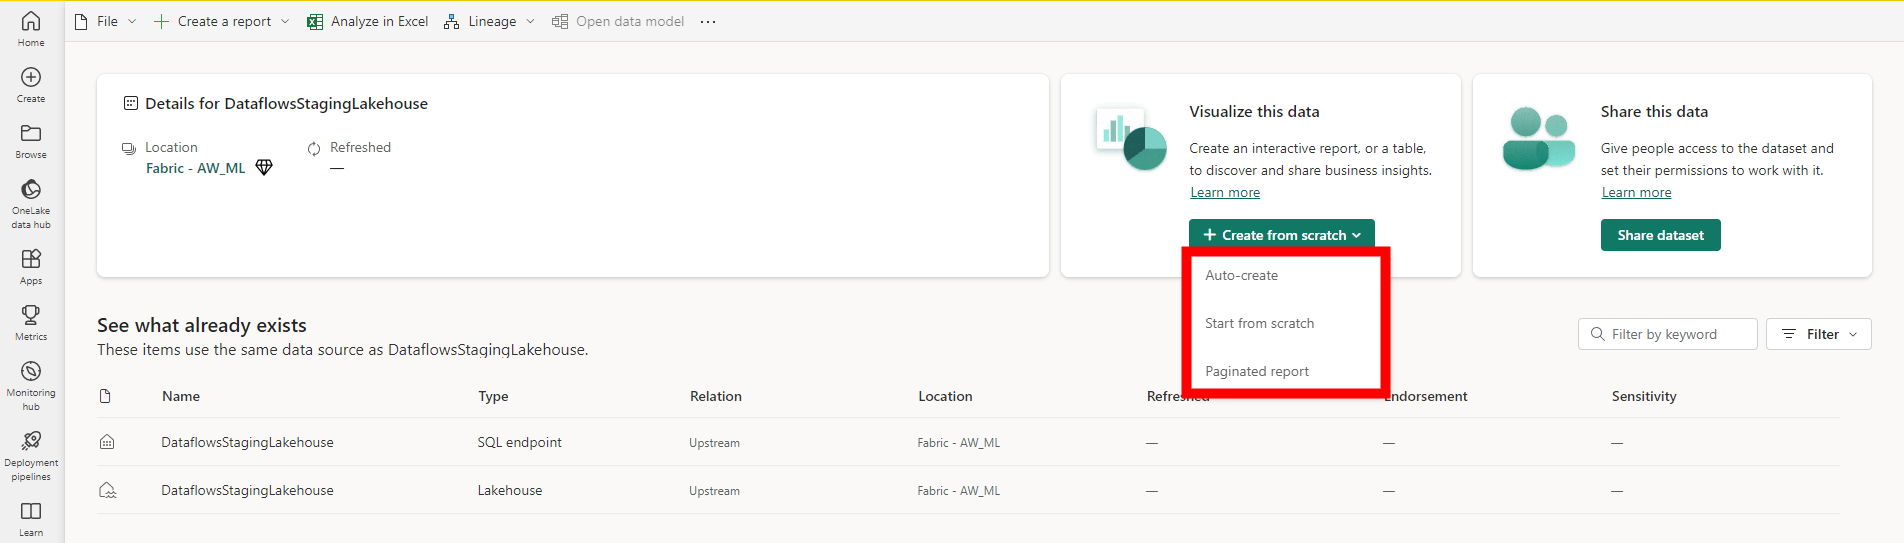
Last but not least, is the data visualization part. No matter if we created a custom dataset in the previous step or went for the automatically generated dataset in the previous step. For visualizing, it’s all the same as we’ve always done with Power BI. One of the options is to build new reports directly in the Power BI Service from the workspace. We can easily go to the dataset and start creating a report, which can be an automatically generated report, start one from scratch or a paginated report.
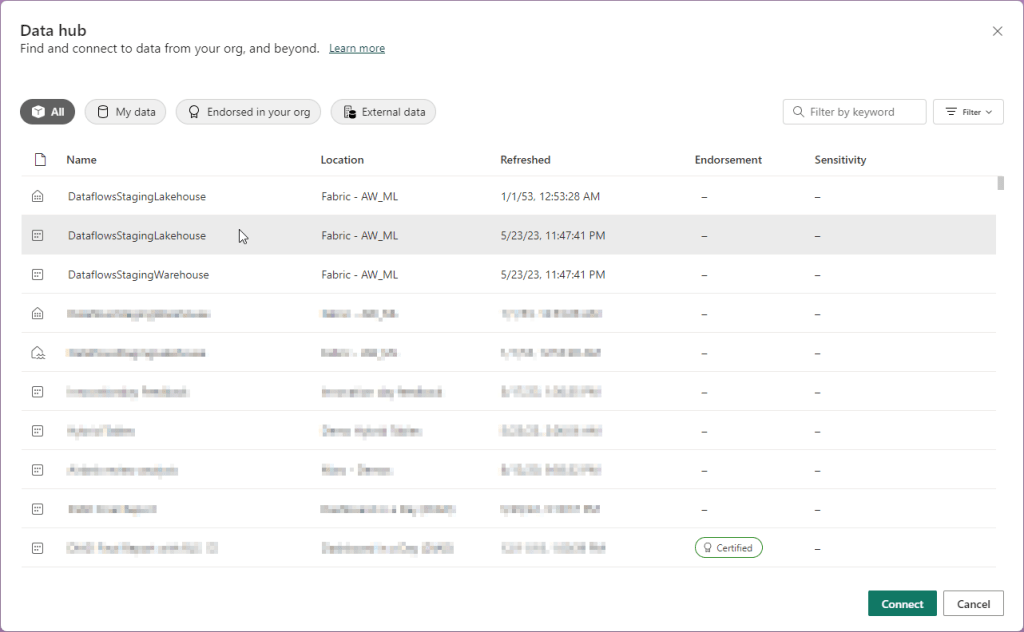
Alternatively, we start building a new report from Power BI Desktop. Within Desktop we can navigate to the datahub and connect to existing Power BI Datasets where the Fabric dataset will also appear.
To conclude
Is there really nothing new? Well of course there are many new things! And there are definitely impactful changes when we look at the setup of workspaces how we were used to have them in Power BI, and how these workspaces can now span many more workloads and artifacts with Fabric. Nevertheless, I think as a Power BI developer, you shouldn’t be worried that you will be out of a job.
Although it looks like you can cover all aspects on your own, by just leveraging the tools you already know from the world of Power BI, I truly believe that data engineers, data scientist and Power BI developers should work side-by-side in the world of Fabric. There is a limit till which extend you can stretch your Power BI skills to get everything done. Therefore, I would say Fabric enables all of us to work in a single environment, in which you as a Power BI developer can easily look over the fence to see what your neighbor Data Engineers and scientists are doing. This opens new opportunities to broaden your skillset and explore the wonderful world of data from different angles. Who knows… maybe one day you might become a data engineer and write Python? But for now, there is nothing to worry about!
The first thing you should start doing right now, is engage with your data engineers and scientists and make agreements on ways of working and manage expectations in both directions. In the end, as Power BI developer you still know better which data model works better for the reporting needs of the end user, than what a data engineer can do. The other way around, data engineers will still be better in building pipelines and writing notebooks to optimally prep the data for your reporting needs. It’s a collaboration in a joined venture!

Pingback: Microsoft Fabric, first impressions – Reitse's blog
You didn’t mention the affect of Copilot on BI developers. That does change things a little.
LikeLike
*effect
LikeLiked by 1 person
It does, but not necessarily with the introduction of Microsoft Fabric as we can use today in Public Preview. So far, the copilot integration is limited. Given the announcements, we can expect this to change over time of course.
LikeLike
Pingback: Governance in Microsoft Fabric: Understanding the Roles and Domains – Data – Marc