You might have seen some buzz around already, although the official blog post is not out yet, the February release of Power BI desktop is already available to download. After a month waiting (traditionally, there is no January update) it has some great new features in it! Not only Tabular Model Definition Language is there now, but more towards solution development, we now have Power BI Visual Calculations! It was announced for a while already, the more excited I am that we finally can start exploring Visual Calculations in practice!
Wait what? Visual calculations?
Yes, you read it right. With the February 2024 release of Power BI Desktop a new way of doing calculations in Power BI has been introduced. You no longer only use DAX for Measures, Calculated Columns and/or Calculated Tables, but now you can also use DAX to add additional calculated fields to individual visualizations.
You might wonder why this is such a big deal. Cause I can already solve everything in DAX right? Well, if you’re Italian, then probably yes, but for a large majority of Power BI users that I talk to, DAX is still a difficult language to work with. Concepts like Filter Context and Context Evaluation are hard to grasp, let alone that you know exactly what you’re doing when you try make a complex calculation. Let’s be honest, how many times have we ended up copy-pasting some sample DAX from a website like DAX Patterns or SQL BI? I did a lot at least!
How will Visual Calculations make this whole experience different? Well, it almost feels like going back to the old days in which we could use Excel and just add up the numbers in various cells from top to bottom or left to right. However, the current experience does not provide a point-and-click interface where we just select a bunch of cells to do a calculation, it is already a massive step forward in simplification. Since Visual Calculations are now released as public preview so I expect a lot more to come in the future.
Let’s explore!
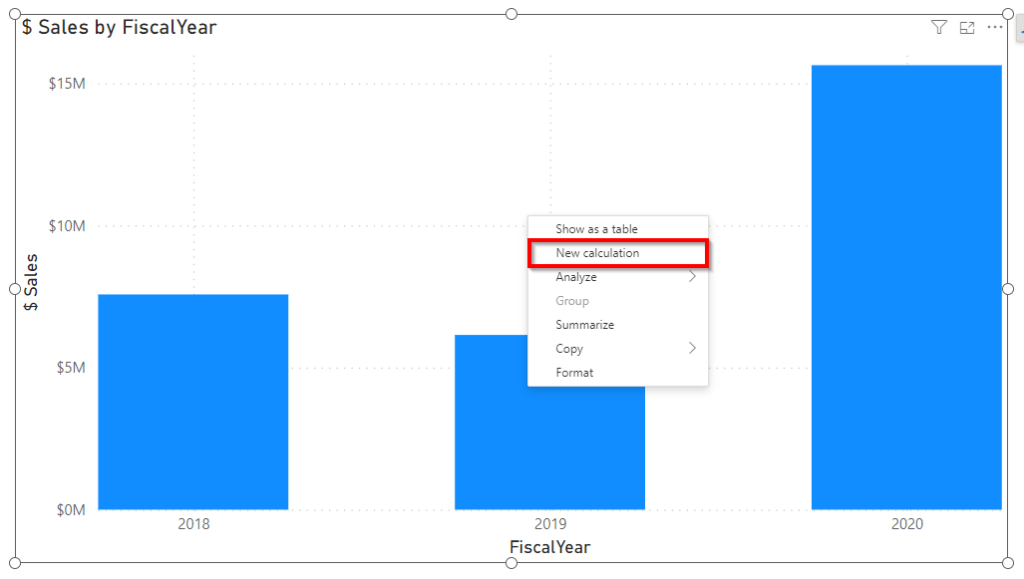
Before you start using Visual Calculations, make sure you enable it in the preview features of Power BI Desktop. After restarting Power BI Desktop, you can start exploring! Once enabled, it’s time to first setup some initial visualization. I’m using the famous Adventure Works dataset, so let’s start with an initial visual, in which I visualize $ Sales by Fiscal Year. In here, I already use a explicit measure Sales, but this is not mandatory to work with Visual Calculations. You can also work with implicit measures if you want.
From the visual I have right now, I can simply do a right-click anywhere on the visual and say, new calculation.
After you clicked New Calculation, a window on the bottom will appear. This allows you to start writing your visual query in DAX. Though, it’s much simpler and straightforward than a regular DAX expression! Let’s take a running sum for example. Instead of writing something relative complex as a Running Sum in a measure, as described in this article by SQL BI, we can now simply write the expression like this:
RunningSum = RUNNINGSUM( [$ Sales] )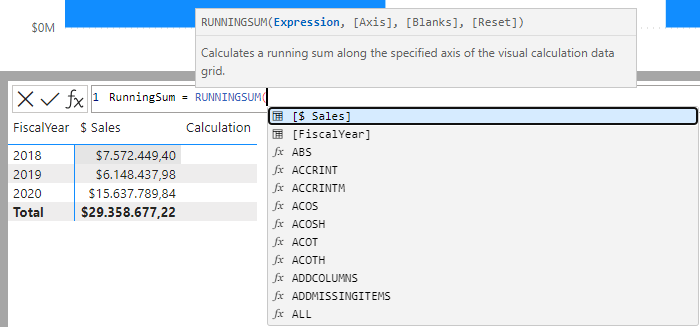
As not all properties of the expression are mandatory, I kept it relative straightforward by only filling the expression in which I refer to the existing column $ Sales. The result we get looks like this:

The RUNNINGSUM function is one we have not seen before in regular DAX and is newly introduced to Visual Calculations. At the time of writing, there is no documentation available yet on this function or other specific Visual Calculation functions, but there is a “magic button” we can click to insert expression templates to help us getting started.
Let’s say we create a new Visual Calculation. Just in front of the expression bar, we can click the fx symbol which shows us several options to directly get started, for example an expression to compare current row versus previous row. The expression we write to make this work is super easy and straightforward, what we are not used to with DAX (at least I am not).
// Template expression provided:
Versus previous = [Field] - PREVIOUS([Field])
// Example working expression
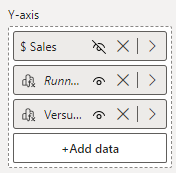
Versus previous = [$ Sales] - PREVIOUS([$ Sales])Also, it is super easy to stack Visual Calculations on top of other Visual Calculations. This helps to break down complex calculations in smaller steps which are easy to validate. Once we only need the final result of a series of stacked Visual Calculations, we can easily hide all intermediate steps from the Fields Pane where we can see all objects that are part of the visual. Only in edit mode of the Visual Calculation, you can hide and unhide calculated objects from the visual, even the original column or explicit measure that came from the Semantic Model.
I have to admit, by stacking multiple Visual Calculations, traceability and aiming definition management will become much more complex and challenging. Especially if you have Enterprise Grade Semantic Models, you might want to rely solely on explicit measures as part of the Semantic Model and not give the freedom to end-users or report developer to create their own version of the truth based on Visual Calculations. Though, as owner of a Semantic Model you also don’t want to be bothered by users for adding all sorts of fancy measures that they need for their own analysis. So, we could say Visual Calculations also gives a level of freedom to end users which might be useful. Traceability is key though, or I can even imagine a Semantic Model setting, in which owners of the Semantic Model can decide whether Visual Calculations on top of their model is permitted or not. I haven’t found anything like this in the settings of a Semantic Model at this moment, but who knows if it will be coming in the future?
Above I only went through a simple scenario in playing around with Visual Calculations. However, many more scenarios can be explored. I did my part, but I encourage you to also start playing around with Visual Calculations and share your thoughts! (make sure you have the February 2024 update of Power BI Desktop).
Wrap up and final thoughts
I’m very excited to start simplifying complex DAX calculations using Visual Calculations! It’s a great step forward in making life of a Power BI report developer much easier! And with that sentence, I initially said report developer. Cause I think that Visual Calculations are a great addition to enrich your reports with all sorts of calculations that are not yet present in your Semantic Model. However, the reusability story of Visual Calculations is a difficult one. Currently, the Visual Calculation solely lives inside that specific visual and cannot be use anywhere else in your solution. Also, it is not saved as part of your data model or anywhere visible or traceable. When we’re talking about Enterprise Grade Semantic Models, you ideally still have your definitions saved in DAX Measures as part of your Semantic Model.
Though, since Visual Calculations are still in preview, I expect a big future is waiting for them! With this first initial release I’m already very happy and I think many users will be! In this post, I only explored a narrow scope of Visual Calculations. But I expect it has a lot more in it, that currently mentioned in this blog. Also, as this post is written at the time no documentation was available yet. I can only recommend you get your hands on the February 2024 update of Power BI as soon as possible and start exploring Visual Calculations on your own convenience! I’m very curious to hear what your first impressions are, what you think of it and how it will change the way how you work with Power BI?
Want to learn more?
Finally, I have to do a shameless plug here! Over the past months, Jeroen (Jay) ter Heerdt (Senior Program Manager for Visual Calculations at Microsoft) and I have been working on training material for Visual Calculations. We’re excited to announce two places where you can join us to follow a deep-dive session where we will explore in more depth what Visual Calculations have in store for you!
Join us during the Dutch Power BI Gebruikersdagen (Community Days)
A 3-day annual Power BI Community event in the Netherlands (in-person only) to hear the latest and greatest about Power BI from both Microsoft and other experts in the field! During this event, Jeroen and I will run a full day workshop about Visual Calculations on Thursday March 7th – in Utrecht Netherlands. Find more information and secure your spot using this link to the Dutch Power BI Community website.

Join us during the Power BI Cruise
The second edition of the Power BI Cruise, this year from Stockholm (Sweden) to Helsinki (Finland) taking place in from June 3rd till June 5th. Jeroen and I will be running a 3 hour session on Visual Calculations during this famous cruise! Join us there to learn more!
Find more information and secure your spot using this link to the Power BI Cruise website.