
As part of Microsoft Fabric, a new storage mode to connect from Power BI to data in OneLake has been introduced. Direct Lake it makes to possible to use your data from OneLake in Power BI without taking an additional copy of the data. Where Direct Lake promises to deliver the performance of Import-mode with the real-time capabilities of Direct query, it is time to have a closer look how data gets loaded into memory and delving into the concept of data dictionary temperature.
In this blog I will explain when data gets loaded into memory, elaborate on how you can measure the dictionary temperature of your data and the effect of queries on the temperature.

Warning: At the time of writing this blog (September end 2023), Microsoft Fabric is still in public preview. Documentation on certain Fabric features and internals is sparse. Specifics might still be adapted to change.
What exactly is Direct Lake?
Direct Lake is the storage mode that has been introduced with the release of Microsoft Fabric. Where one of the pillars of Microsoft Fabric is a single copy of the data, across all engines, this also includes Power BI. Traditionally, we mainly looked at import and Direct query as storage modes for Power BI. The best practice (at least for me) has always been to use import unless you have a very specific reason to use Direct query. Though, often data architects might have come up with an argument that they didn’t want to duplicate the data once more between the data platform and Power BI, what is typically what Import does. However, I tend to see it more like caching of data in Power BI rather than a copy of the data.
Putting that aside for now, because I can talk for a while about the typical discussions that I’ve had with architects on the customer side in the past. Now, we have Direct Lake as part of Fabric, which promises to give import-like performance and Direct query freshness of the data. Also, in line with the whole Microsoft Fabric story, it will not take another copy of your data, but Power BI will read the delta files directly from OneLake into Power BI.

From reading the Microsoft documentation on Direct Lake, my understanding is that it’s more a scanning principle of data, rather than loading it in memory in advance. As soon as a column got called, either by visualizing it, running a DAX expression on top of a column or crossing a relationship in which the column is used, that specific column gets loaded into memory.
When we talk about memory, we’re talking about the premium or Fabric capacity memory in this case. With Direct Lake, we have a significant difference from import storage mode in Power BI. Simply as with import the data model as a whole into memory, where Direct Lake loads the data per column.
To directly address the elephant in the room, this does not mean that optimizing datasets is no longer relevant and you don’t have to care about how wide your fact table is and could easily bring along tons of additional (descriptive) columns. Definitely not! All generic data modeling best practices still apply, such as having a star schema and rather having fewer columns but more rows.
Temperature of a column
When data is loaded for the first time from OneLake to the active memory using Direct Lake in Power BI, you might experience slightly slower performance than when you start interacting and filtering the data in your Power BI report later on. This is because the first time a column gets queried, it first has to load into memory. After that, the performance is much faster to my experience.
As soon as the data is loaded into memory, we can say the data becomes warmer! But what exactly does that mean? The data temperature is a fictive value that is being generated inside the engine. The more queries hit a certain column, the higher the temperature will become. Over time, when the data is not used, the temperature will slowly go down.
Let’s take the analogy of us human beings that also operate best at a certain temperature. If we’re cold during winter, we dress warmer to make sure our body is at a decent temperature to do what we do. If we’re cold, we have a hard time getting this done. You could think about the same concepts for data that needs to warm up first before queries perform well.
Measuring temperature
Measuring the temperature of a column is what we have to do using tools like DAX Studio or any other tool that can connect to the XMLA endpoint of a dataset. From the dataset settings menu in our Fabric workspace, we can get the server address which we connect to using DAX Studio in below example.
As soon as we have DAX Studio connected to the dataset, we can make use of Dynamic Management View (DMV) queries. One of the queries we can use, is the $SYSTEM.DISCOVER_STORAGE_TABLE_COLUMNS which provides an overview of all attributes in a dataset, as well as dictionary sizes and the dictionary temperature.
Below the example query that I executed.
select DIMENSION_NAME, COLUMN_ID, DICTIONARY_SIZE, DICTIONARY_TEMPERATURE, DICTIONARY_LAST_ACCESSED
from $SYSTEM.DISCOVER_STORAGE_TABLE_COLUMNS
order by DICTIONARY_TEMPERATURE desc
I run this query before I opened the report connected to this dataset. The result I got, was basically empty columns for both the dictionary size and temperature.

Then, I opened a report where I visualized simply the sales by product color in a simple bar chart.

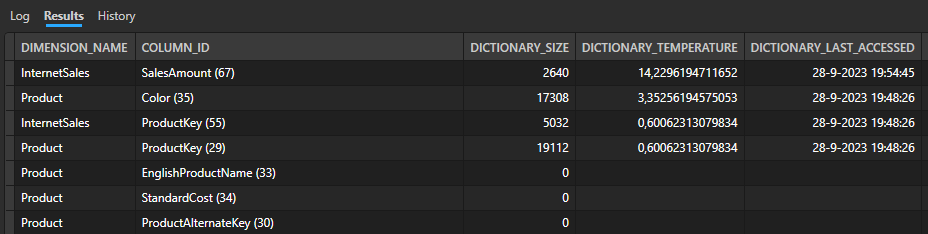
The query executed to get above visualization includes data from two tables, being the product dimension and the Internet Sales table. When we rerun the DMV query to get the data temperature, we see that four columns are being loaded in memory and suddenly show a dictionary size and temperature.

This is the moment that we can conclude that four columns actively got loaded into memory. You might have expected only two columns, but the two additional columns that got loaded are the primary key in the product table and foreign key in the internet sales table that connect both of our tables in the data model. Therefore, you see a total of four columns loaded.
When I rerun the same query again a few minutes later without interacting with the report or any other activities happening on the capacity, the temperature already dropped a bit. But let’s add a second visual to the report now, in which we also visualize just the total sales in a card visual and the average sales amount for an order in the internet sales table.

Currently, our report queries the Sales Amount column for three separate visuals. We can expect the temperature of the Sales Amount column to be significantly higher and that is also what the DMVs show us.
In above result from the DMV query, you might also notice that the last accessed date and time are different for the other columns. That is basically because the Power BI report is also using front-end visual caching. Therefore, you will not see these values getting updated. To prove that the numbers of queries hitting a column influences the temperature, I made sure that all data was dropped from memory and temperature was back to zero. After that, I re-opened the same report with the bar chart and two card visuals. That gives a similar result as above, with a temperature of 14,x for the sales amount column and the other columns being far lower.

Performance
It’s hard to judge on specifics for the query performance, as there a lot of factors that can influence this, such as complexity of the query, data types of the columns, capacity size and other actions being performed on the same capacity to which the memory has to be shared. Therefore, I’m not going to tell you whether the performance of Direct Lake is fantastic or not. I think you have to experience yourself before you draw any conclusions.
As I said above, the total memory of a capacity has to be shared across all workloads being executed at that time on the capacity. Compare it to your own computer, if you open your task manager you can see all things going on at this moment in time. If you’re hitting the limits and you try to load an additional program, you will experience slowdowns. Similarly, the memory of a capacity works to my experience.
In case you hit the limits of your capacity, performance might be slower, as well as the query might cause a fallback to DirectQuery instead of using Direct Lake. The best way to measure this, is from the performance analyzer pane in Power BI desktop. In the specifics of each query, you will see various categories appearing. As soon as one of these categories is DirectQuery, that means the query has run over DirectQuery instead of Direct Lake. I will not go into details on how to measure it, as this is properly documented by Microsoft on this page.
Circling back to data temperature and combining this with the overall capacity utilization, we can say that the temperature of the data drops faster when more operations happen on the capacity. The process of dropping data from memory is what we call evection from memory. My gut feeling tells me that this entire process and all other processes on a capacity have a big influence on how performant your queries are over Direct Lake and when it falls back to Direct query. However, there is no documentation (yet?) that proves or describes how this eviction process is exactly happening.
Final thoughts
Till what extend the query temperature is influencing performance, is hard to figure out at this point. We can at least conclude that, the hotter the column is, the more this specific column gets queried. Also, the range from min to max in which a temperature of the column is defined is unknown at this moment. At least so far, I have not seen a freezing column with a below zero value and neither a cooking column with a temperature above 100.
The exact influence of other processes and other Fabric workloads, I have not looked at. The case I described above is entirely based on using Direct Lake datasets from Power BI on top of OneLake data. I can imagine other workloads querying the same column will also have an influence on the dictionary column.
In the final example I used above, I made sure no data is in memory. This is an action you can influence as a dataset owner. Given this blog is lengthy and complex already, I will not go into details on that in this blog but follow-up on this concept in the next blog. For now, I hope this blog helped you understanding a bit better how Direct Lake works and the concept of dictionary temperatures at least.
Finally, a bit shout out and credits to Benni de Jagere (Fabric CAT team member at Microsoft) for the conversations we’ve had on this topic, knowledge he shared. Also, thanks to Mathias Halkjær for figuring out some details and co-presenting on this topic at Power BI Next Step 2023!

Pingback: Data Temperature in Microsoft Fabric – Curated SQL
Pingback: Exploring Direct Lake Framing and warm-up data using Semantic Link in Fabric Notebooks – Data – Marc
Pingback: how to pre-warm your power bi semantic model from fabric data pipelines.
Pingback: 50 Shades of Direct Lake - Everything You Need to Know About the New Power BI Storage Mode! - Data Mozart
Pingback: Orchestrate Power BI Semantic model refreshes through Fabric Pipelines – Data – Marc
Pingback: Everything You Need to Know About the New Power BI Storage Mode - Data Shield
Pingback: Everything You Need to Know About the New Power BI Storage Mode - ProfitlyAI
Pingback: Everything You Need to Know About the New Power BI Storage Mode – Singularity Feed
Pingback: Everything You Need to Know About the New Power BI Storage Mode – Zovi AI
Pingback: Everything You Need to Know About the New Power BI Storage Mode – CryptoKeeperCanada
Pingback: Everything You Need to Know About the New Power BI Storage Mode – Finance StarGate
Pingback: Every thing You Must Know In regards to the Recent Power BI Storage Mode | BARD AI
Pingback: Everything You Need to Know About the New Power BI Storage Mode - dudivo.com
Pingback: Every part You Must Know In regards to the New Energy BI Storage Mode - Automationscribe.com
Pingback: Everything You Need to Know About the New Power BI Storage Mode | Technical Terrence
Pingback: Every part You Must Know In regards to the New Energy BI Storage Mode - newsaiworld
Pingback: Everything You Need to Know About the New Power BI Storage Mode – AIBS News
Pingback: Lakehouse Teil 3 – Zugriff aus Power BI mit dem Direct Lake Modus – Linearis :: Power BI & data1.io