
Discussions with clients regarding the performance of their data models in Power BI have been a frequent occurrence for me recently. The issues often involve failed refreshes, queries that run slowly, or models that do not meet the clients’ expectations. In most cases, I begin by asking a standard set of questions before diving into the optimization process.
In this blog post, I will delve into the characteristics of each scenario, typical findings, and where to start optimizing. I will also share my experiences and highlight potential pitfalls from the viewpoints of data engineering, Power BI developers, and product owners. Furthermore, I will explore the design patterns that can be utilized to enhance performance. These tips and tricks can benefit both Premium and Power BI Pro users with their datasets.

Help! My dataset does not do what it should!
Sometimes if people ask what I do for a living, I could have answered that I’m a fireman. Though, not fighting against a real fire, but fight against poor performing refreshes in Power BI, or let’s say poor performing Power BI solutions in the broadest aspect. Am I a fire fighter? No, but it feels like that every now and then. Over the past years, I’ve had many conversations with clients in this sense.
Recently, I also had a customer questioning whether they made the right decision by choosing for Power BI roughly a year ago or given their requirements they should have chosen for a different tool. When I started the conversation, the first thing I asked is why they had the feeling Power BI might not be a good choice for them. It all came down to the same things again. Typically, the same things keep coming up:
- My dataset refresh fails, why?
- The dataset became way bigger (in GB) then we expected, do we need to buy more premium capacity?
- Should we consider putting everything in directQuery, cause the Power BI data model became too big?
- Users are complaining about poor performance when they build a report. What can we do?
- … Probably you can think of a few more yourself.
At the client where I last encountered these questions, the intention was to put together domain-oriented datasets from day one they worked with Power BI. Each dataset comes with standardized report(s) and can be further used by the business in self-service scenarios. The entire build process of the datasets was rushed though, which is something we should not forget. This is an important detail, as this was the bases of the problem that created itself. Not too long ago, I also wrote a blog about migrating to Power BI, which was partly based on the same client case. There I wrote that you should never rebuild exactly what you had in the old situation, as you’re also migrating all legacy and crap from the past. Instead, you should reprioritize the importance of the solution and reinvestigate the requirements with the business.
As a result of the migration, all datasets grew exponentially. While only 1 year of historical data was loaded, and the original plan was to go 3 years back in time. Due to a dataset size that was already over 40 GB, there was no option to further extend the time range of the dataset at this moment in time. But what caused the dataset to be this big already? Well, I can tell you…
Alignment between data engineering and Power BI developers
At the beginning of the migration, a design decision was made to not include any logic in the Power BI data models, but instead leverage the data platform behind as much as possible. With that, the Roche’s Maxim was followed by doing your data transformations as far upstream as possible, but as far downstream as necessary.
Due to the rushed migration, all (wide) tables were added to the Power BI solution, just like in the old dataset. And since the agreement was to not include any transformations should be done in Power BI, the table was imported into Power BI as it was served in the views of the data platform. Due to other priorities and sometimes miss alignment, the data engineers did not always have time or not get the right priority to further optimize these views for usage Power BI, as their priority was to enrich the views with more details, build new solutions and migrate the data platform from old to new at the same time as migrating to Power BI.
The role of the product owner
Product owners also played an important role in the challenge encountered. The migration to Power BI had a hard deadline on which the old systems would be shut down. Therefore, everything should be built in the new environment, validated and signed off by the business before this date.
By taking the domain-oriented approach, some old solutions were merged together. As a result, the dataset kept growing exponentially. Also, because of the long backlog of reports to migrate, there was a (too) little to no focus on optimization of the datasets, instead we just kept adding more columns, entirely new tables and wider tables.
The business users also often came up with new requirements which needed to be added to the solutions, where for example analysts wanted to analyze sales data at order line level. You can imagine that the granularity of the dataset was insane. Due to the way how Power BI compresses the data, lots of unique values existed in columns which made the table size grow extremely as well. Not even talking about the additional columns that were needed to analyze on this level of detail, which led to a wider table.
But hey, as long as it works, don’t touch it! Right?
At least that is what happened. Until the first refresh problems started to occur. That’s when we started firefighting and applying hot fixes on daily bases to keep the data available for the end users. Under pressure things got back to work, for as long as it would last. Cause it wouldn’t take long until new requirements from the business came in. Their ask: More data, more details and more ways to analyze the data for self-service purposes. Some push back to the business was what was needed, but not what happened. Work items were defined, tasks assigned, and the datasets needed to be extended even further. And then… well I think you can guess by now.
But why were these new requirements accepted, you may ask yourself now. Well, without these enrichments the solution was not valuable (enough) for the business, and they would not accept the solution.
Where to start optimizing?
I might have to disappoint you at this point. I’m not going to write down what kind of optimizations you should do, or what the requirements are of a good dataset. Therefore, I happily redirect you to Kurt Buhler his blog, where he put together the Data Goblins Dataset Checklist. Though, I will put together a few questions everyone should ask themselves when building a Power BI dataset.
While the client was facing all above issues, I received a mail where they openly questioned where Power BI was mature enough, and whether Power BI was the right tool for them. I started writing a long mail back to them, but also thought it would be better to discuss in a meeting and do some further analysis on what exactly was going on.
During the meeting, I basically started questioning some of the design choices made earlier in the process. Below I will add a bunch of those questions including some additional explanation on why this caused an issue for this client.
What about the refresh? When does it run and how is it configured?
The refresh was one of the failing aspects of the current solution setup. The solution was refreshing during night, based on a scheduled refresh. The time was set based on the finish time of all processes in the data platform. Though, the refresh trigger was not chained together with the orchestration processes in the data platform. What happened is that all (large) datasets started at the same time to kick-off their refresh.
In Power BI Premium, each dataset can grow up to the RAM size of your capacity SKU. For a P2, this would be 50 GB. So, you might expect they should be fine. Well, that statement is based on the dataset in use for query execution and visual rendering. Not necessarily for dataset refreshes. There are various resources on the internet that describe how large the dataset can be, but there are no hard numbers. I usually take ~60% of the capacity SKU size as max dataset size during refresh. That means that a P2 could take up to 30 GB.
Nevertheless, whatever SKU size would have been in place, the load performed on the data platform does not change. Each query executed by Power BI during the refresh has to be received – executed – returned by the platform. If the platform does not scale on the backend, we will build up a huge load on the platform side if all refreshes run at the same time. Although the Power BI refresh was already incremental, we had one of the biggest bottlenecks here.
Last but not least, you could wonder why all refreshes had to wait till all processes in the platform were finished. Also, as they are not chained together, if a process delays in the data platform, all other processes might load old data, or even worse fail. Ideally you start triggering the refreshes in Power BI effectively once the data platform is ready. Therefore, you need to setup orchestration, for example with tools like Azure Data Factory. Based on the enhanced refresh API you can start triggering individual tables in your Power BI dataset as soon as they are ready in your data platform. With that you make the refresh way more efficient and shorten the end-to-end process time of platform and Power BI combined. Also, in the unfortunate case something goes wrong, only one table failed to refresh and has to be restarted instead of the entire model.
Granularity of the data
The level of detail was also an interesting aspect in this dataset. The sales table was on a granularity of sales order line. In case a sales order received a complaint, about one of the products in the order, the complaint number was added as a foreign key to the table. This created the link to another fact table where all the complaints were listed. Not that bad, you might think. Though, it completely depends on the purpose in which the dataset is used.
For analysis of your sales, a simple flag (null or 1) in a column which identifies whether there is a complain to this order would have been enough as well. Based on that you can do a simple calculation which returns the number or percentage of complaints out of total orders.
But what if you want to analyze a specific complaint for order ABC123? If I don’t have those details in the dataset, the users may not be able to do that? Again, this is where the solution design comes in. You can totally do this, by creating two datasets.
- Sales dataset, including the sales order and the flag column as described above.
- Order Complains dataset, including the orders for which a complaint is received.
The complaint dataset will be way smaller, at least I truly hope so. The dataset should only include the orders which have a complaint. Based on cross-report drill through users can jump from one Power BI report to another by using cross-report drill through. Detailed analysis on complaints should happen in that dataset rather than the sales dataset. Also, the sales dataset will be simplified a lot, by just having the flag, many columns and even full tables can be removed from the sales dataset.
User defined or automatic aggregations and purpose of reporting
To repeat it once more, all data was based on sales order line level. Super detailed highly granular data resulting in a large dataset. Is that really necessary for the purpose of analysis? You can wonder who will be actually analyzing the data on transactional level. Often, this is happening to just export lists (Excel files) with data that they want to further analyze in detail or use in other processes. In case that happens, you can also ask yourself if that is the purpose of reporting, or whether this is a gap in functionality in an operational application that you try to fill with Power BI. Another perspective to it, could also be that some deeper analytical insights should be prepared by data scientist, where the output of their algorithms and models will be input for Power BI, rather than doing all these analysis on low granular level in Power BI datasets.
In case you came to the conclusion that you might not need that detailed level data at first hand but want to be able to drill down to details of individual orders based on outlier detections for example, you can perfectly consider implementing user defined aggregations. This was suggested many times before in the design phase. However, the solution design was rejected by the lead architect as lots of maintenance might come in to tailor the aggregations based on actual user behavior. Luckily the automatic aggregations can help perfectly in this scenario to prevent changing the aggregation level every time.
With aggregations you get the best of both worlds. Data that is used often will be imported and directly available to users in good performance, while detailed data can still be looked up with directQuery. Also, while looking up detailed data over directQuery, the queries will be far more efficient if the query is based on a drill-through or drill down, as the where clause of the query will be filled based on the filter applied in Power BI.
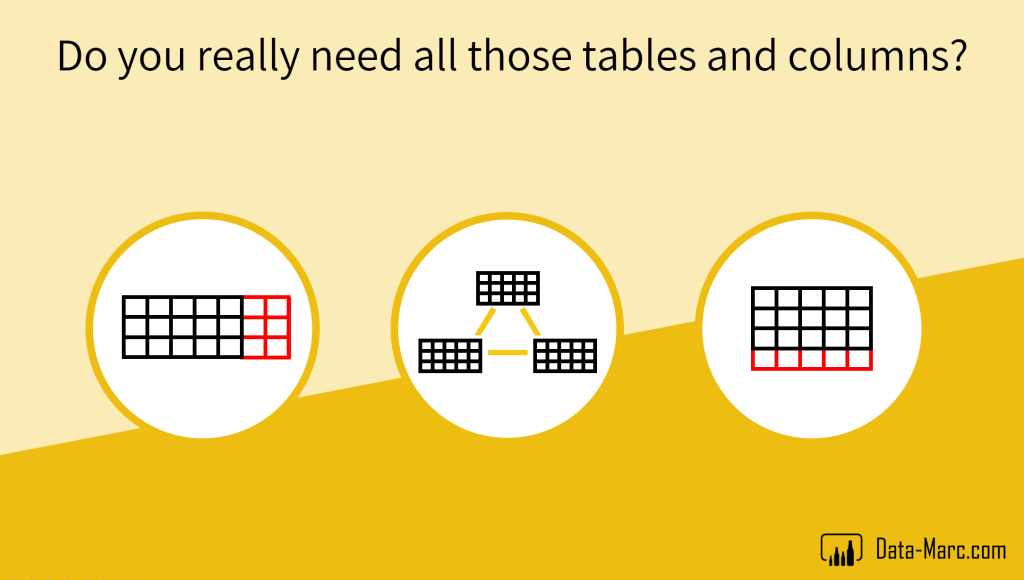
Do you really need all those tables and columns?
The dataset also had a stunning number of tables. For some you could question why they were not appended together. For some others you could wonder where they were not further modeled into a dimension as a fact table had descriptive information. This seems to be a challenge that keeps coming back in many data models that I see. Proper star schema is what always should be aimed for to get the best out of Power BI and make the data easier understandable. With that, the fact table should include only foreign keys to the dimensions, being surrogate keys, and numeric measurements like sales amount, order quantity and all other things that can be aggregated. Everything else should belong to a dimension.
Many of the tables in the model I had a closer look at, included tons of columns that should have been put in a dimension, or were not used at all in the reports. Paul Turley wrote an excellent blog on developing large Power BI datasets and in specific detail tables where he clearly highlights to avoid big wide tables.
Remember as I highlighted before, the design principle was to not have any transformations in Power BI, and since those columns were in the views coming from the data platform, it was not prioritized by the product owners to drop the columns that were not necessary. Instead, a simple and quick fix could have been applied by the Power BI developer to only select the required columns by using the Table.SelectColumns function in PowerQuery. The query would have been optimized by query folding and actually dropping the columns from the views by the data engineers could have been put on the backlog for later. To avoid breaking the solution when the data engineers dropped the columns, it is important to use the Table.SelectColumns instead of Table.RemoveColumns as the latter function hardcodes the column names that will be dropped. As a result, the next refresh will fail. Just a little thing to keep in mind and avoid the error at that time.
Wrap-up
So far, I’ve listed typical questions which led to discussion in the meeting I had with this client. Overall, the meeting had a positive vibe. Together we defined the way forward, reprioritized tasks and defined the steps to take to make the end-to-end solution more stable. Of course, the list of questions and topics is incomplete and there is far more to take into consideration than just these items.
In the end, I had one intention with this blog, which is mostly just sharing experiences and typical questions you can ask yourself or your developers while building Power BI data models, depending on which side of the table you are. In the end, I would still say, domain-oriented datasets are the way to go. Though, make a clear distinction between what should be covered in analytical reporting solutions, what analysis could be prepared by data scientist for example, and what typical use cases should be covered in operational applications.
To summarize, the following points are important:
- Fact tables should only contain surrogate foreign keys and numeric measurements, keeping them narrow.
- Dimensions should capture all descriptive information.
- To convert detailed data into measurable information, consider using flag columns available on the platform.
- Cross-report drill through can be used to create smaller datasets that can still interact with each other, as long as they share similar dimension(s).
- Aggregations can be used to reduce the amount of data imported into your Power BI dataset.
- To streamline the process, chain refreshes together and orchestrate your data platform workloads and Power BI refreshes in one place.

Pingback: The Hidden Impact of Keys in Your Power BI Data Model – Data – Marc