Have you been working with Composite Models in Power BI? Did you run into challenges while you did? Then this blog is for you! In this blog I will further elaborate on what the composite models (including DirectQuery for Power BI datasets) are and everything that comes into play when you start implementing them.
During this blog I will introduce you to topics like source groups, storage modes and relationship evaluation. All different topics that come into play when you start building composite models.

Understanding composite models
Composite models are there in Power BI for a long time already. Some people might think that a composite model only exists with a Power BI dataset or Azure Analysis Services model connected over DirectQuery, but that is just a small portion of what composite models are about. In fact, a Composite Model is a data model that combines data from different source groups. Not to be confused with storage modes.
Source groups
Each data source in your data model, is considered to be a source group. We have to know, that each DirectQuery data source gets its own source group, and all imported data in our data model lives in the same source group. With that, we can say that a composite model is;
- A data model that combines data from multiple DirectQuery data sources.
- A data model that combines imported data with data from DirectQuery data sources.
The latter is the best known one, when we talk about composite models, where two storage modes are combined. Now we understand what source groups are, we can safely say that storage modes are strongly related, but not directly telling us if something is a composite model or not.
Storage modes
Now we have a better understanding about source groups, the next step is to get some confusion out of the way when we talk about storage modes, or let’s call it connectivity modes for now.
In Power BI, you can have a Power BI dataset which is published to the service, with one or multiple Power BI reports connected to it. The connection between a Power BI dataset and report, is what we call a live connection. Same concept applies when you connect to (Azure) Analysis Services models. This has not to be confused with storage modes, as it is something different. Live connections typically only allow you to build visualizations based on the data model as already defined. You can add new measures, but you cannot make any other changes to the model.
When we want to make changes to a model, we can identify three different types of storage modes. With data connected via one of the three options below, you will be able to transform the data using the Query Editor in Power BI Desktop. Depending on storage mode, limitations might apply of what you can, and cannot do in the Query Editor.
- Import: all data is imported directly in your local Power BI Desktop instance and you will have the full functionality available. Import is sometimes also called cached, as the data is available in cache within your local engine.
- DirectQuery: the data will not be imported to your local engine, but when the query is defined, the query will be send to the upstream data source. DAX expressions are typically converted in SQL queries to be executed on the data source side.
- Dual: with Dual, the data source is connected in both DirectQuery as well as Imported to the local engine. Depending on the query context, it behaves in one way or the other. Dual mode can effectively be used to avoid cross source group relationships when you use user defined aggregations for example, or other combinations of tables in different source groups.
Storage modes can be defined on a table level in Power BI desktop, and can be set from the model view. Also, the storage mode in Power BI desktop can be identified by the look of the table in the model view.
- Imported tables are shown in white.
- DirectQuery sources have a colored bar on top of the table.
- Dual has a dashed bar on top of the table.

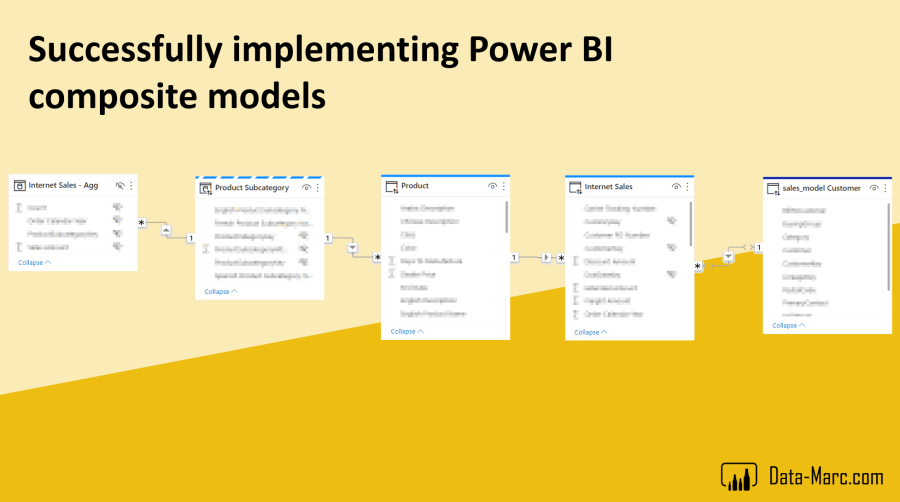
Besides identifying the different storage modes with the colors, also the various source groups will be identified in the model view. In below example a second DirectQuery data source is added to gather Customer information from Azure Synapse Analytics. As you can see, the sales_model Customer table is identified with a dark blue bar on top, which tells us this table lives in a different source group.

Relationships evaluation
With composite models, we also have to keep in mind that we have to deal with different types of relationships in our data model. Within Power BI, we can identify regular and limited relationships (previously known as strong and weak). Depending on the type of relationship, it might have implications on the way how your data model is performing, as it operates a different type of join between the two tables during the relationship evaluation.
- Regular relationships, relationships that stay in the same source group and being one-to-one or one-to-many. During evaluation, Power BI can determine which side of the relationship is the one-side and what is the many side, which it can use in its benefits for calculations within the model.
- Limited relationships, relationships that cross source group and/or being many-to-many. With limited relationships there is no guaranteed one side of the relationship during the relationship evaluation.
The behavior of both types of relationships are important to understand. As with regular relationships, the behavior can be identified as left outer join between two tables with one-to-many and full outer join for one-to-one relationships. You might have seen the blank value being introduced in your visualization, in case there was no matching row between the two tables defined in the relationship. As a result, Power BI shows the blank category, to sum-up the other relevant data and be able to show the total.
With limited relationships, this blank value will not show up, as it is evaluated as inner join, and only show the relevant values that exist on both sides of the relationship. As a result, the data shown might be incomplete, as the blank value with the non-matching rows is not shown in a visualization at all.
Limited relationships can be identified in the model view by the open brackets on each end of the relationship as shown in below example.

Connecting to a Power BI dataset in DirectQuery
Typically, when you connect from Power BI desktop to an existing dataset in the Power BI Service, you will have a live connection. In order to convert this live connection into DirectQuery, you have to click a button which says “Make changes to this model”, which allows you to convert the live connection into a DirectQuery connection. With that, the dataset will now be approached as a DirectQuery data source, which gets its own source group.
A Power BI dataset is in this case nothing more and nothing less than just a data source. All principles described above with regards to source groups and storage modes apply. In fact, we can say that “DirectQuery for Power BI Datasets and Azure Analysis Services” is just another connector that supports DirectQuery.
When the dataset is in DirectQuery mode, you can use it in any setup building a composite model, by adding other sources to it like your local Excel files, other databases or even other Power BI datasets.
Goals and non-goals of DirectQuery for Power BI Datasets and Azure Analysis Services
Especially with the DirectQuery for Power BI datasets and Azure Analysis Services models, you might run into some challenges. Since the beginning, there have been specific goals for this feature on how it is designed. Keep this in mind when you are working with composite models, as this can avoid you from hitting road blocks or suffering from poor performance, like limited relationships where incomplete data might be shown.
Goals for DirectQuery to Power BI datasets and Azure Analysis Services
- Extend: Add data to an enterprise semantic model.
- Enrich: Add measures, calculations, formatting to enrich enterprise semantic models without adding any data to the model.
- Overview: disjoined tables, to give a business overview, sort of dashboard functionality, but in a report interface with report functionalities.
Non-goals for DirectQuery to Power BI datasets and Azure Analysis Services
- Combining two or more large sources by joining large shared dimensions.
- Combine large fact tables from different sources.
Challenges
There are many different things that can result in, let’s say less optimal performance when working with composite models. Below some cases that you might encounter whilst working with composite models.
I created a composite model, but ended up with a limited relationship. What now?
This is a very common case, which you will experience when you implement user defined aggregations in Power BI for example. Following this example, with user defined aggregations you will have two fact tables, where one is on DirectQuery and the aggregated data is imported to your data model. As a result, you might end up with a limited relationship between the dimensions and your imported fact table.
If you want to prevent this from happening, the trick is to set your dimensional tables to Dual storage mode. With that, the data will be imported and made available in DirectQuery mode. The query engine will decide when to use which storage mode for this table. So if you use the dimension in combination with a DirectQuery fact table, both tables will be approached in DirectQuery mode. In case you combine the aggregated imported data with the same dimension, the data will be approached in import mode. Keep in mind that this is only applicable when all tables in this scenario come from the same source, meaning they reside in the same source group.
I have added a new measure to the original data model, but it is not visible in my composite model while viewing in the Power BI Service.
The first case, is easy to explain, as during refreshes in the Power BI Service, your model metadata will not be refreshed, but only the data itself. Metadata is only refreshed in Power BI desktop during evaluation. Therefore, keep in mind that if you want that new measure to appear in your model, you have to run a refresh in desktop first and publish again to the service. So, it is key to save your desktop model in a versioning system, which allows you to always roll-back to previous versions if needed and is backed-up like OneDrive, SharePoint, Git or anything of your preference.
I build a visual that uses two of my existing Power BI data models, but the performance is very poor!
In general, keep in mind that a composite model always involves at least one DirectQuery data source, and general DirectQuery limitations apply. Also, In the non-goals as described above in this blog, might already prevent you from running into things, as it is not intended to combine multiple large data models together.
So, did I just say that you cannot achieve your goal by using composite models in Power BI? No, I did not. Cause there is another setup you can choose to achieve the same goal. Potentially you can also import existing models using the Analysis Services connector and using the Power BI Premium XMLA endpoint. With imported data, you will experience better performance.
Conclusion
Composite models in Power BI is a very powerful feature, which brings many new options to the table, like building near real-time solutions or dealing with large data volumes which do not necessarily have to be imported. Typically, composite model setups are indirectly integrated in features like user defined- or automatic aggregations in Power BI as well as Hybrid tables where it is integrated even on a partition level.
While dealing with different source groups, always keep in mind how relationships in Power BI work and the risk of ending up with limited relationships and the risks of that. At all times, importing data will give you the best end-user performance and most options in Power BI. So the same best practice remains “Import unless…”
In this blog, there is not spoken yet about potential security implications and the query engines handling the calculations. If you want to learn more about that, I recommend to review the official documentation on this topic. Also, the combination of Calculation Groups in composite models is not discussed. This will be a follow-up blog after this one.

Excellent post!
I have one question. Is there a way for identifying source groups in case of multiple DirectQuery sources programmatically via DMV query or model.bim?
The only place I can certainly see 3 different source groups is in model view.
I didn’t find this storage location on DMVs and the information. I found at model.bim only said if it is import or direct query (without differentiating between different DQ source groups).
LikeLike
Hi Renato,
Excellent question. Honestly I don’t know if you can identify source groups via DMVs. I will investigate and get back to you in reply to this.
–Marc
LikeLike
Hi Renato,
I checked with a few others, unfortunately there is no out of the box option to query source groups. With the DMVs you can query partitions which you can use to build/script something to investigate source groups.
–Marc
LikeLike
Pingback: Implementing a Power BI Composite Model – Curated SQL
Hi Marc,
>Potentially you can also import existing models using the Analysis Services connector and using the Power BI Premium XMLA endpoint.
I guess we are also allowed to import data by using Power BI REST API:
POST https://api.powerbi.com/v1.0/myorg/datasets/{datasetId}/executeQueries
( https://docs.microsoft.com/en-us/rest/api/power-bi/datasets/execute-queries )
LikeLike
I think this comment is a bit off topic. The API referred to, serves a complete different purpose. Also, I don’t see a direct relationship between this post and the the XMLA endpoint. But I might be off, please elaborate 🙂
–Marc
LikeLike
Hi Marc,
We have our model in Azure Analysis Services.
I’ve created a report in PowerBI Desktop on the model, added e few generated tables to it (converts the live connection into DirectQuery).
When I publish the report to the service all visuals show the same error
Couldn’t load the data for this visual.
the license is PowerBI Pro
I’m admin on the tenant, and on the workspace.
Allow DirectQuery connections… is enable in the tenant admin
live connections to the model from this workspace work fine.
What else can be wrong.
Filip
LikeLike
Hi Filip,
I don’t hear any particular reason why it shouldn’t work. You can check your model permissions, do you have build permissions? Should be set automatically with admin on workspace level.
Else, I suggest to open a support case at MSFT.
–Marc
LikeLike
Marc,
I’ve checked all upfront.
Next Tuesday we attend dataMinds in Mechelen.
I saw you’re one of the speakers.
Perhaps we can discuss this face to face when you have time.
Filip
LikeLike
Great! See you there!
–Marc
LikeLike
Hi Mark
Is it possible to creete composite model in power bi desktop report server?
If not is there any alternative to do that in rs version?
LikeLike
Hi Ami,
Not as far as I’m aware off. I advise to go check the documentation on composite models.
https://learn.microsoft.com/en-us/power-bi/transform-model/desktop-composite-models?WT.mc_id=DP-MVP-5003435
–Marc
LikeLike
Hi Marc,
Thanks for the post. I wanted to agree (strongly) with your assertion that it is very hard to use composite modeling (directquery for datasets) to combine large data from different sources.
You mentioned this type of composite modeling in the section titled “Connecting to a Power BI dataset in DirectQuery”.
After spending a lot of time in the performance analyzer (too much time) I discovered that the problem with queries against remote datasets is that the query engine wants to gather a conclusive list of relevant tuples from one dataset, before sending them as a predicate to the other. Sometimes the list of tuples can be 100’s of thousands of tuples or more. And that is where performance degrades in a big way. I’d guess that the parsing of the DAX alone can take a huge portion of the time. HOWEVER I noticed that whenever a portion of the data resides in the local model, then the need to transmit lists of tuples may be eliminated. A that point Power BI will gather relevant tuples as the OUTPUT from the remote dataset, and won’t need to re-transmit this list as INPUT to another dataset. Instead it just hash-matches against local data in memory.
As a workaround you suggested: “Potentially you can also import existing models using the Analysis Services connector and using the Power BI Premium XMLA endpoint. With imported data, you will experience better performance.”
I found another easy workaround that works pretty well. If you just create a local “calculated table” in the composite model, and use that for visuals, then the query engine will be a lot happier. Eg. “Inventory (for Calcs) = Remote Inventory”. As long as this calculated table is added into the local model, then the other large datasets (like the list of inventoried products) can remain remote, and still perform well since low-level tuples aren’t transmitted back and forth between remote datasets.
Hope this is clear. Like you, I’ve noticed a lot of discouraging performance behavior when trying to use composite models. But the strategy of using calculated tables gives a small bit of hope. And maybe some day Microsoft will improve the query engine to treat one of the PBI datasets as if it were local, and thereby execute as quickly as it does with the calculated tables.
LikeLike
Thanks for your addition, David! Could be a nice work-around but haven’t tested this yet.
–Marc
LikeLike
So lets say I have two large models A and B in Power BI, both in import mode. created long time ago. Now I need to make a new report that needs some data from model A and some other data from model B.
If I understood this correctly, it is not encouraged to use composite model and just connect to both A and B for making new report?
So should I then make a new even bigger model C where I import all the data which previously was residing in separate models A and B now to be all in one model?
Best regards,
Domantas
LikeLike
Hi Domantas,
The devil is in the details! If you want to build one report over Model A and Model B, that’s fine, as long as you don’t create a relationship between both large models (like connect a large dimension to another large dimension). Consider it to be a “dashboard functionality” where you can create an overview report over both models, but the models will operate individually and will not interact with each other.
The example to move towards model C, could be a good approach in case you want to combine the data from the two different models in a single visual, which requires you to create relationships across model A and model B. Likely, A and B share a good few dimensions, which also leads to having several tables in the model twice. Instead, you can better develop model C, which has centralized dimensions linked to the fact table.
Hope this clarifies,
Marc
LikeLike