
Back in January 2020, I visited the Power BI Days in Belgium, where I had a talk about custom page navigation in Power BI. I already started playing around with the Power BI REST API and URLs to create a personalized navigation. As other bloggers might recognize, I ended-up as a draft blog but I never took the time to complete it.
Since then a lot of things happened in Power BI. First mayor change is the ability to add page navigation to buttons without the need for bookmarks and since the May 2020 release we have the ability to conditionally set the navigation destination.
Well… now this is a native functionality, which made me decide to pick up this topic again, delete all content that I initially put together and re-write everything.
Custom page navigation use case
Why should you customize your reports for your end-user? In the example, I am using, we have a company which operates in multiple countries. Every country manager might have different requirements for the report. You, as a report author, must deal with this and might have built separate reports for every country.
Imagine that you are about to make a change to your data model or adding another data source to your report. This results in either editing multiple data models or (if you used one centrally managed dataset) editing multiple reports. On another note, it can be annoying to work with multiple files as well.
From an end user perspective, it is very user friendly to see that the report is adjusted to your personal preferences. Similar is the case for page navigation. If I am the country manager for Germany, I would prefer the report to be adjusted to my area.
With row level security you can filter the report down to only the specified area you want. But in this case, we want clarity over all countries. So, we do not want to filter the dataset itself, but only customize the end user interaction. For this setup, we will still use row level security, but in a different setup.
Dynamic page navigation setup
In my initial setup, I was planning to use the report page URL + report section id to dynamically create the URL in a DAX expression that can be assigned to a button in Power BI. A big disadvantage of this setup was the fact that this will reload the full page in your browser. Luckily, the new setup is much easier!
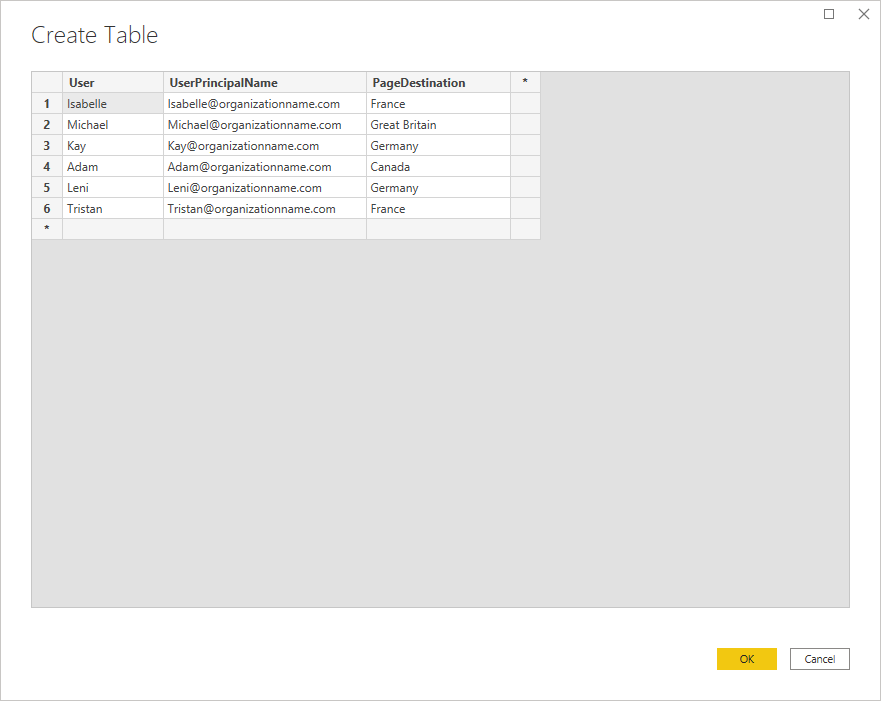
Now, with the native functionality in Power BI, it is as easy as adding a (manually entered) table to your Power BI Dataset. Based on this dataset, you can create a measure that captures the selected value. As a last step, this measure can be assigned to a button to trigger the navigation.

Page Navigation Destination = SELECTEDVALUE( ReportPages[PageName] )Detailed description on how to create the navigation can be found in the May 2020 feature summary.
In the example shown in the feature summary on the Power BI blog, they use a dropdown menu to select a page you want to navigate to. In my example I’m going to expand it further by customizing the page navigation based on the user. As you might have noticed, I have added two more columns in the manually entered table. We will use this information later on.
Build the customized page navigation
As you might have noticed in the screenshot above, I did not only enter the Page name in the table, but I also added the Page Description and a Short Text. We will use all these different fields to
- Define the button text
- Define the button tooltip (hover over)
- Define the button page navigation destination
Our goal we want to achieve is that every country manager can navigate from the sales overview page to the page he/she is representing. All this with one button that is always on the same place in the report. I have listed down the steps to take below in order to dynamically setup the page navigation end-to-end.
Our starting point for below step-by-step setup, is that we already have the table setup including the page names (sample above).
1. Add the user table and filter with row level security
Because we want to automatically filter the navigation based on the user logged in, we need to add one more table. Depending on the exact use case and if you have security/active-directory groups setup, you might use a slightly different setup. For the example is using hard-coded usernames.
2. Create the relationship with the pages table
Once we have the user table configured, we create a relationship between the PageDestination and the earlier added Page table. Make sure the relationship has cross filter direction set to Both and the checkbox for Apply security filter in both directions is enabled.

Both the ReportPages table and the Users table do not need to have a relationship with the fact table or any other dimensional tables, since we will not filter the dataset, but only the page navigation.
3. Add the row level security filter
After we have created the relationship between both tables and set the filter direction correct, we must apply the row level security filter. In the example we have userprincipalnames listed, therefor the filter is pretty simple.
[UserPrincipalName] = UserPrincipalName()
After this step, we will be able to filter the pages table to the preferred destination for every user in the table. Assigning users to this row level security role is similar to any other row level security setup.
4. Create measures
As introduced before, we want to have three different components that we want to define dynamically in our page navigation. For each of them, we need to create a measure.
Define the button text
Button Title = SELECTEDVALUE( ReportPages[Short Text] )Define the button tooltip (hover over)
Button Tooltip = SELECTEDVALUE( ReportPages[Page Description] ) Define the button page navigation destination
Page Navigation Destination = SELECTEDVALUE( ReportPages[PageName] )5. Setup page navigation
After we have created three measures, it is time to add a button to our report. This button need to be configured according to the just created measures. As a first step we add a button to the report canvas. Choose the button you prefer.
Button text
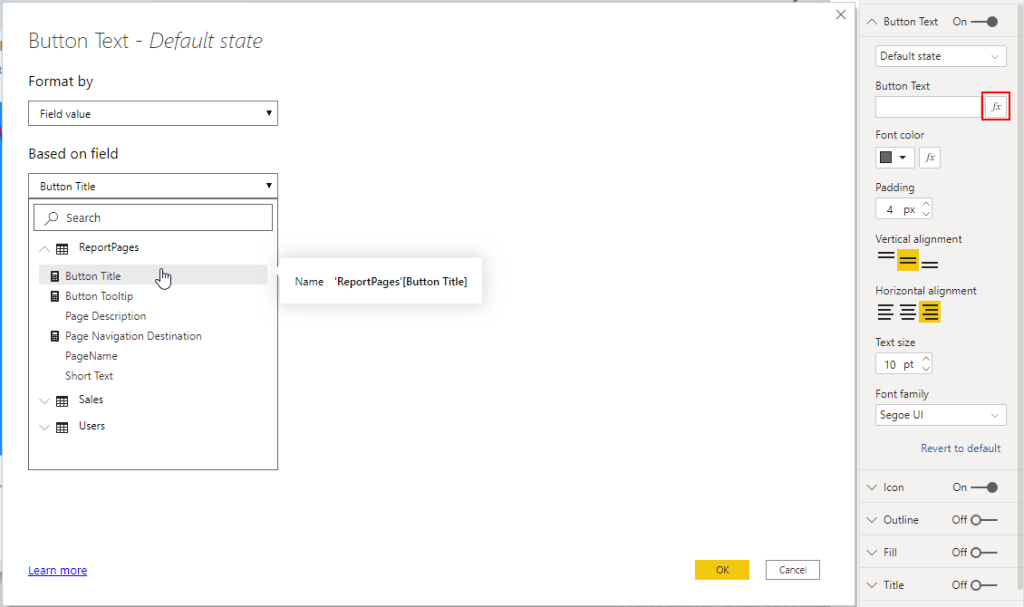
In the properties of the button, we can configure the Button Title (not required). The Button Title can be represented by the just created measure with identical name. By clicking the small fx symbol, you can select the measure to be referenced.
Page Destination
In the Format Pane you will also find the Action settings. Here you can set the button action to type Page Navigation. Next is to click the small fx icon to select the measure Page Navigation Destination in the Destination field.
Button Tooltip
Last but not least, it looks a bit smoother to have a customized text when the user hovers over the button. Therefor we created the third measure Button Tooltip. This tooltip is defined in the Action section of the Format pane. Like the previous steps, click the fx icon and select the earlier created measure.
Results
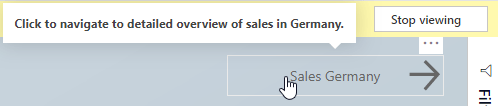
Now we have everything configured, it is time for some testing. As first test, I impersonated Kay, our sales representative for Germany. In below example we see that the tooltip is customized as well as the button text and button action.

As second test, I impersonated Isabelle, our sales representative for France. Here we see similar results but customized for France.

I assume you believe all others work as well. For your reference, I uploaded the PBIX file as example to my github repository where you can download it for your own reference.
Wrap up and Remarks
Personalizing your page navigation can be the next step in report customization. With customized page navigation as described in this blog, you can easily configure different actions behind a button depending on the user looking at the report. Let your end-users feel like they matter and the report is built in specific for their needs.
Especially with lots of different requirements this can be an easy way to have a clear and easy navigation to the most valuable information in your report for every user. You can even decide to hide all pages in the report and fully rely on custom build navigation.
Though, there are a few remarks to make. Even though this almost looks like page level security, it is not! My advice is to not use this as page level security. Every page has a ReportSectionId that is represented in the URL. Even if you hided the pages, with tweaking the URL users can still navigate to other pages. This ReportsSectionId is a guid, so not that easy to find the appropriate guid for other pages, but there are tricks (like the Power BI REST API) to get the different pages in a report with the related guids.
Another remark based on the sample I described above, is the way how I setup the user related filter. I hard-coded a list of users with their related region. As an alternative for the hard-coded list of users, you can use different roles in the row level security setup and assign users to these roles. With that approach you do not need the user table but only a table to be filtered by the DAX expression configured in the row level security setup.
Last but not least, in all measures used in the example, I assumed that all report users are assigned to at least one role. Therefor the second argument in the DAX expression SELECTEDVALUE was not needed. If you have users that are not assigned to a role, the button will not have any functionality. Filling the second argument in the expression will help here to add an alternative result.
Finally, there is one extension of the above solution that already crossed my mind. I left this out of this blog to avoid more complexity, but you can extend the formatting of the button icon and text based on the state. For example, you can change color on hover over, click or when the button is disabled (also introduced in the May 2020 release).

Pingback: Personalizing Power BI Page Navigation – Curated SQL
Pingback: One report for multiple audiences – BI Polar
The PBIX file you made available for download doesn’t work, not sure what’s wrong with it, but clicking the navigation does nothing.
LikeLike
Can you elaborate on what exactly doesn’t work? What do you mean by “navigation”?
LikeLike
Hi!
Thanks for interesting article! I can’t make it work in my real-life reports, however this works in test report. My real-life reports are based on a “live connection” to A Tabular SSAS model, my test report is based on other “import” sources. I made a table in the SSAS model with the page names and also made an in-report measure with page names. Still, all the fields, including the in-report measure” in the fields-picker after choosing “Based on Field Value” are greyed out.
How do I manage to get around this problem?
LikeLike
Hi Håkon,
I’m not sure if this is a known limitation or a bug you ran into. Did you find anything in the documentation? Otherwise I would suggest to log a support ticket and discuss with a Microsoft support engineer.
LikeLike
Pingback: The Truth About Hiding Pages in Power BI Reports: Why It’s Not a Security Feature – Data – Marc