As Power BI enthusiasts and consultants, we are building tons of reports. All with the goal to enable the business to take data driven decisions by providing them with the right information at the right time. Though, if your reporting audience is growing, there is no way to satisfy all your users. Of course, the key-users will provide you some feedback, but why not directly ask the target audience if they like your report or not?
In this blog I will elaborate on measuring usage and satisfaction of your reporting audience in Power BI by tweaking the usage metrics and creating a custom measuring solution using Power Automate.
Report usage metrics
There is no easy way to get direct insights in your reporting audience, other than the usage metrics provided from a Power BI service perspective. These insights are valuable, however very limited at the same time. This will only provide you insights based on usage day-to-day usage of one specific report. But there is an option to get these insights in a broader perspective.
Follow the below steps to get these insights for the whole workspace and get the ability to customize the report:
- Open the usage metrics report in one of the reports.
- Click on the three dots (…) in the top ribbon and click Save a copy.
- Give the report a reasonable name and click Save.
- After you saved the report, open it and click Edit.
- On the right side, you will notice a report level filter applied on ReportGuid.
- Reset this filter and customize the report like you want it.
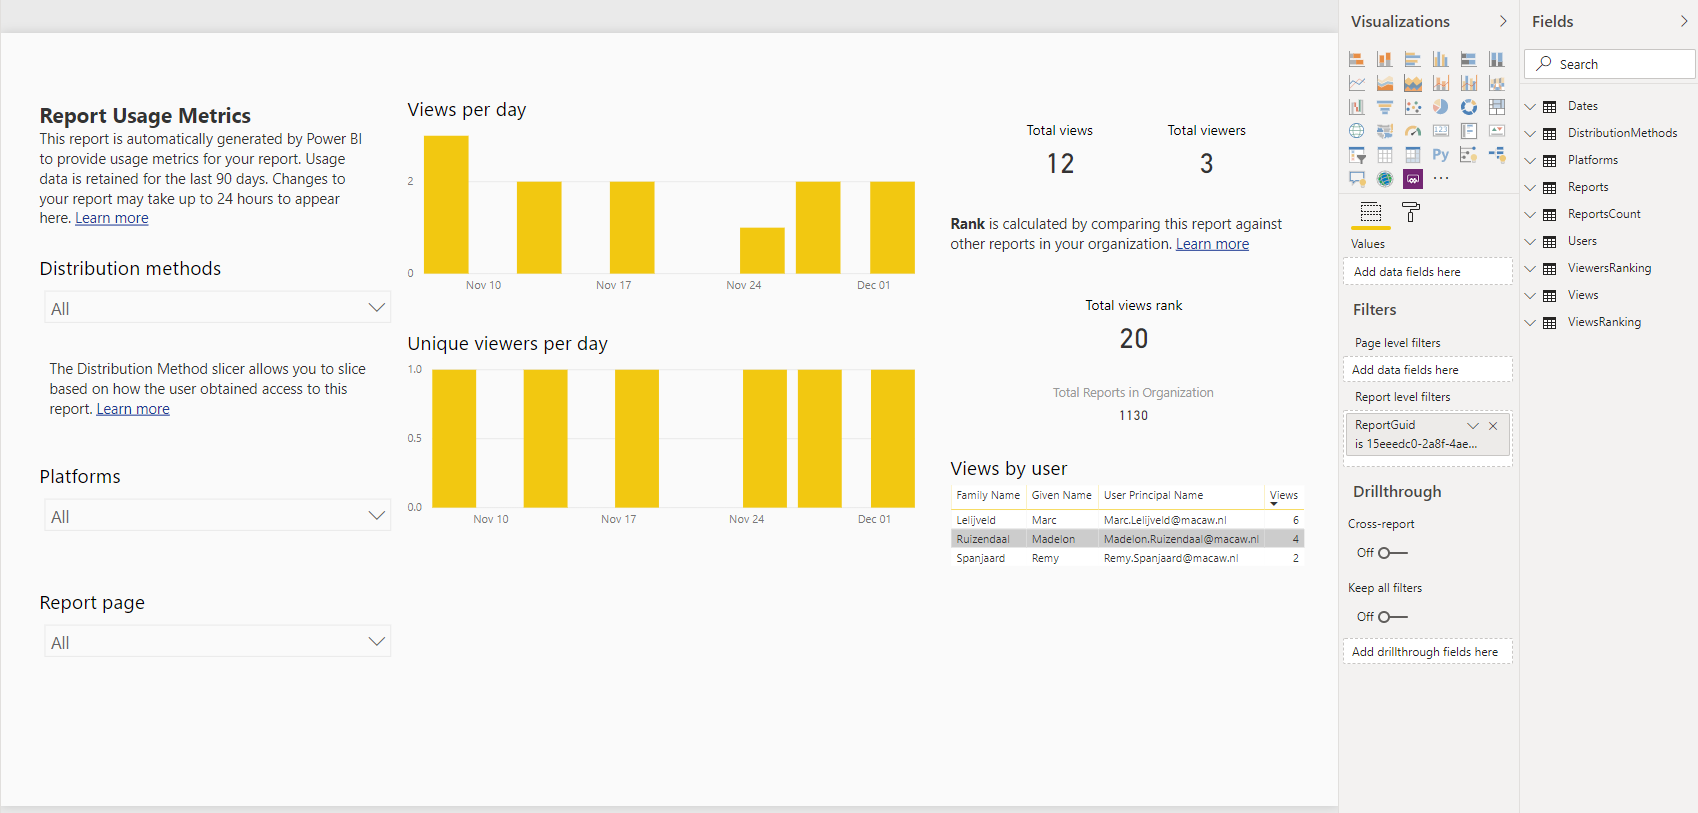
With this little trick, you can change this context to all reports in the same workspace. However, it is still limited and you can only see the actual usage of reports, but you still have no clue if your reporting audience is happy with these insights or not.
The native commenting functionality, as documented here, can already help you a bit. A hidden feature which ask some real dedication from your end-users to take the time and type their feedback. Also be aware that comments here are publicly available for everyone who has access to this report, since comments are not part of row-level-security. Besides that, very positive or negative responses might influence each other. What to do now?
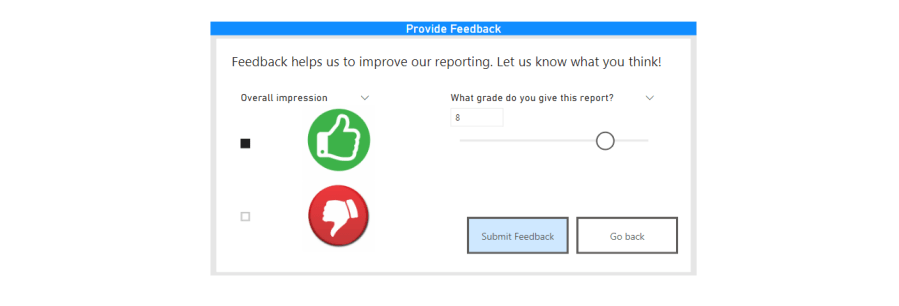
Measure sentiment! Thumbs up, or thumbs down?
Why not make it easier for your end-users to provide you some feedback? A one-time investment by setting up your own report sentiment analysis will allow you to easily collect feedback across all your report. You can do this by using Microsoft Power Automate (Microsoft Flow). Based on the following setup, you will be able to collect the following insights:
- Thumbs up / Thumbs down, get some basic understanding if your end-user likes the report or not.
- Date and time, which give you some more detailed insights in when your report is being used. Can be useful if you want to update your report and possible down-time.
- Who is this end-user, providing you feedback? Also makes it easier to get in contact with users sending in negative feedback. Maybe you can have a word with them and collect additional requirements for future improvements.
- Optional: collecting a numeric rating how much they like your report.
In the following section of this blog I will describe step by step how you can setup a solution like this.
Setup the Flow in Power Automate
For those of you who are not familiar yet with Power Automate, formerly known as Microsoft Flow, this tool allows you to easily create automated workflows based on different triggers. Besides that, Power Automate is part of the Power Platform, just like Power BI.
Create a new Flow
We go to Flow.Microsoft.com and create a new flow. We are going to build everything ourselves, so we choose for a new flow from blank.
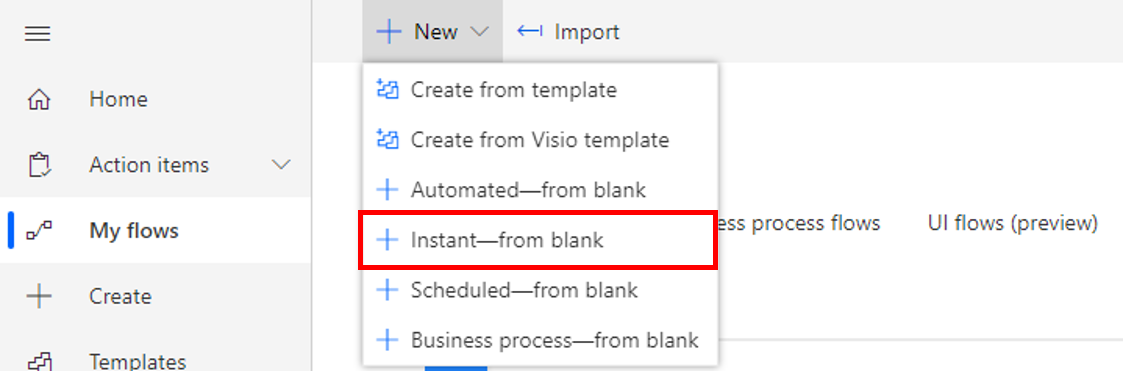
The pop-up dialog does not include the right trigger we want to use. Just click Skip here, we will select the right trigger later.
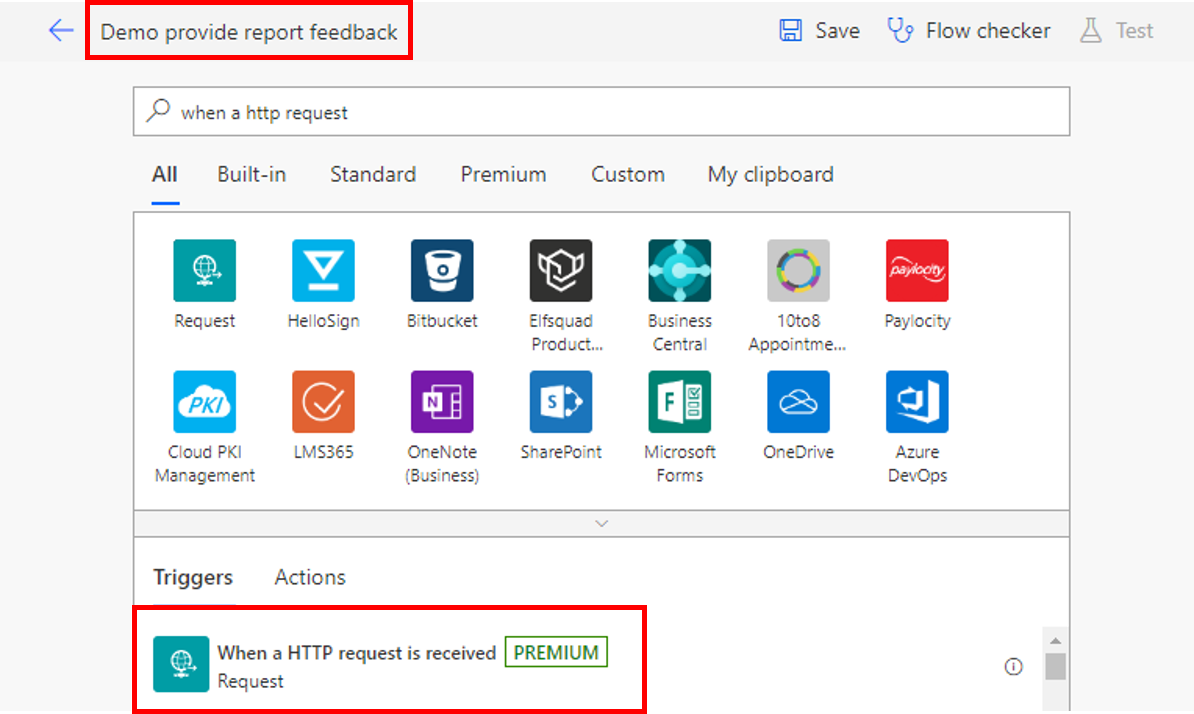
Define the trigger
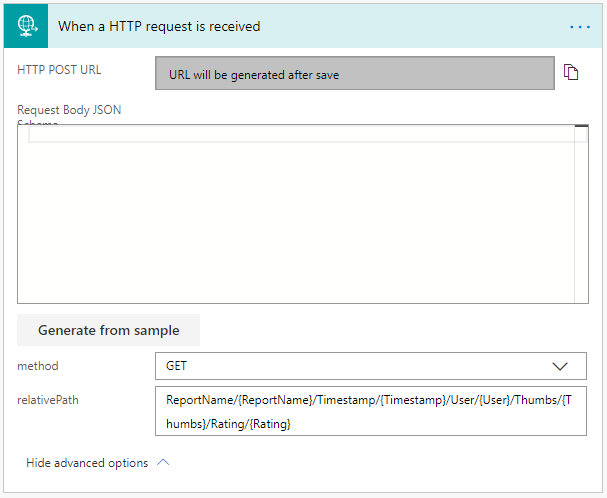
As soon as we have created the new blank Flow, we can give it a reasonable name on the left top. Besides that, we can directly select the right trigger we want to use. This trigger is called When a HTTP request is received please search for this trigger on top and this trigger. Notify that this is a premium trigger in Power Automate. More about premium features in Power Automate can be found in the licensing FAQ documentation.
Next, we will define the method for the HTTP trigger, which is GET here. We want to retrieve information with this URL trigger. Besides that, we will fill the relativePath with all parameter we want to set in the URL. These parameters can be filled with content later in Power BI. Here we will define what our URL will look like. In this example we will collect the following information:
- Report Name, since we want to use this solution for multiple reports.
- Timestamp, when is this feedback provided.
- User, who provided this feedback.
- Thumbs, is the feedback positive or negative.
- Rating, number in a range representing the score for this report.
Of course, you can also use a subset of the above-mentioned parameters. In this example I will show you the setup I have used myself. The relativePath used for the above approach is shown below, where I first define the parameter and afterwards in curly brackets the parameter to fill.
ReportName/{ReportName}/Timestamp/{Timestamp}/User/{User}/Thumbs/{Thumbs}/Rating/{Rating}Also notice on the top that the HTTP POST URL is not available yet. This is the URL we will trigger from Power BI to send data to this flow. The HTTP POST URL will become available after saving the Flow.
Define the response
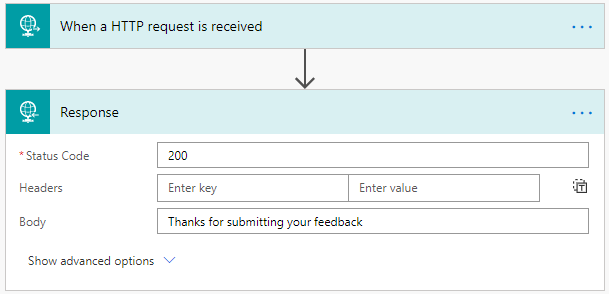
Obviously, we want to notify the people providing feedback that their feedback is received well. We will set this up very easily by adding a new step to our flow, called Response. In case the HTTP request is triggered correctly, this will return a Status Code 200. That is the only one we setup now, of course you can also setup this approach for other Status Codes.
In the Body we can type some text, or even insert dynamic content. For now, we just enter the text “Thanks for submitting your feedback.”
Save the data
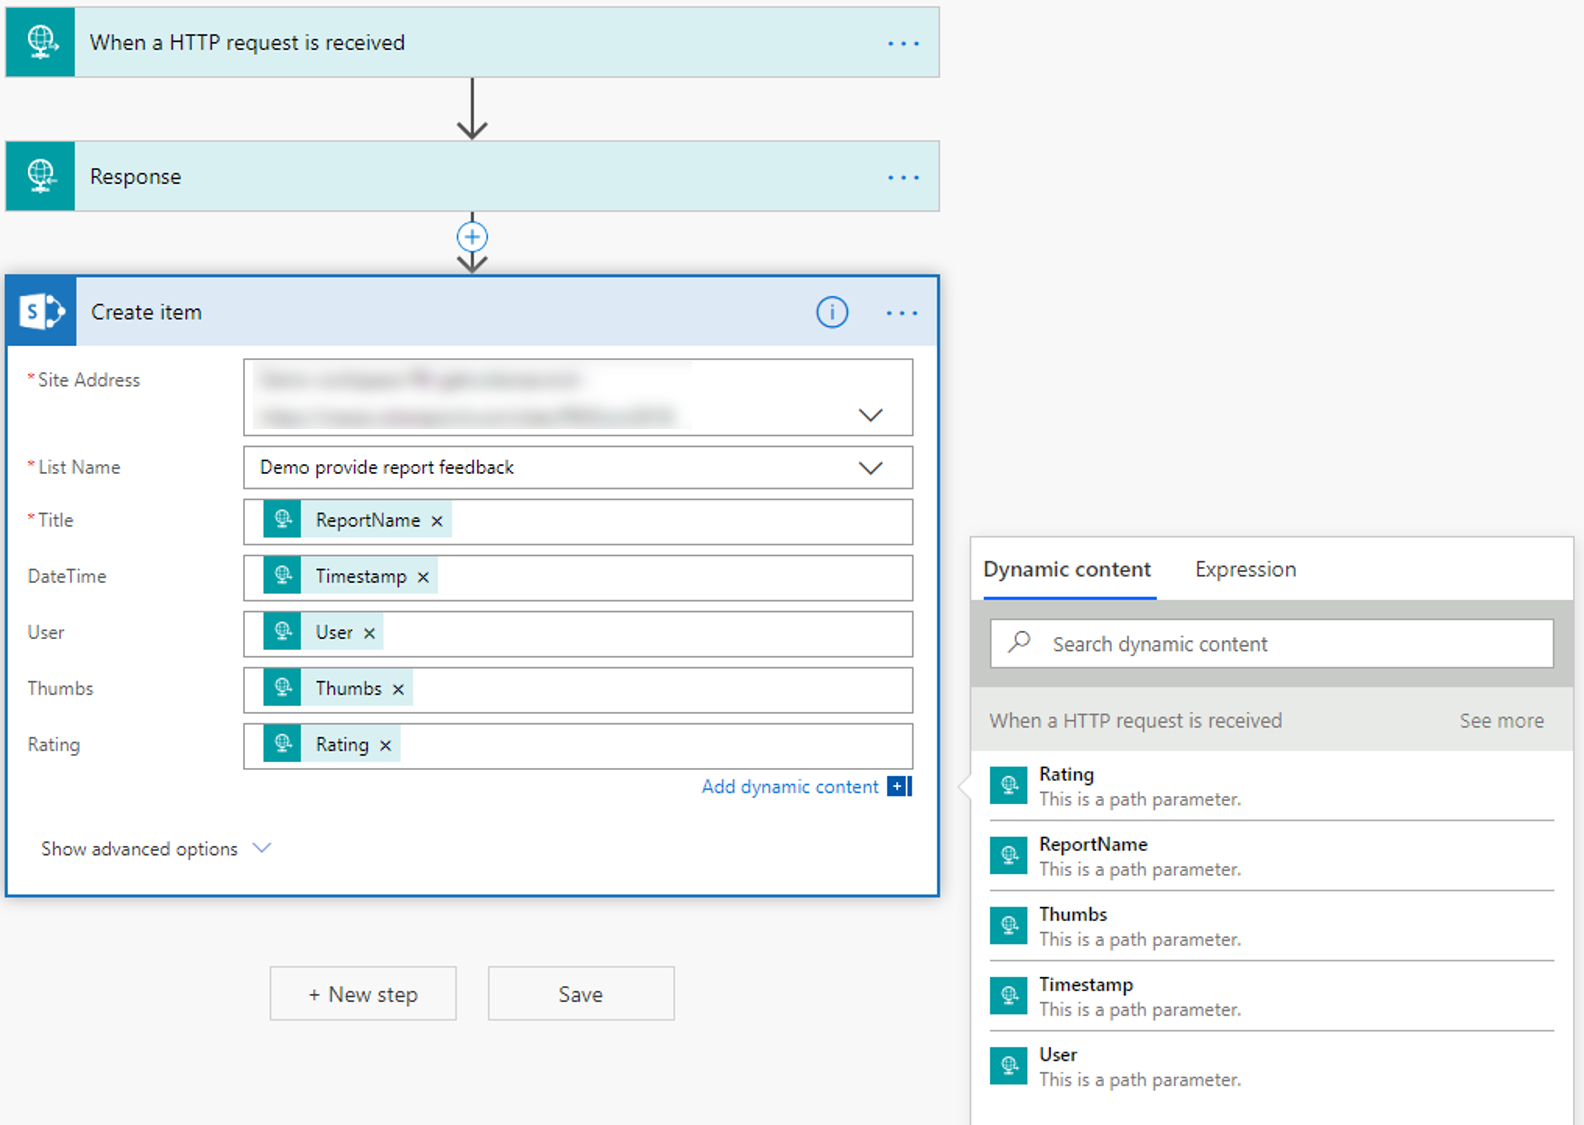
Finaly, we want to save the data received somewhere. From a BI perspective, you probably want to save this in your datawarehouse or datalake. For now, keep it simple and store it in a SharePoint List. If your don’t have one yet, find here how you can create a SharePoint List easily. Make sure that the table where you will insert the data has the same columns as defined above as parameters.
By using the action SharePoint Create Item we can easily select the Site Address and List Name where we want to save the data. Afterwards the available columns in this list will show up and can be filled with the available Dynamic Content retrieved as a response from the first step in this flow.
After this step, our Flow is ready. If you haven’t done yet, save the flow and have a look at the HTTP GET URL mentioned earlier and provided in the first step of this Flow. This is the URL we need later in Power BI.
Setup the feedback process in your Power BI Report
Now, the Flow is ready, it is time to implement this in our Power BI report. To make this work, we need to implement a few things. In the flow we defined what parameters we want to fill. From a Power BI perspective, we need to make sure that these parameters will all be filled.
Thumbs up or thumbs down
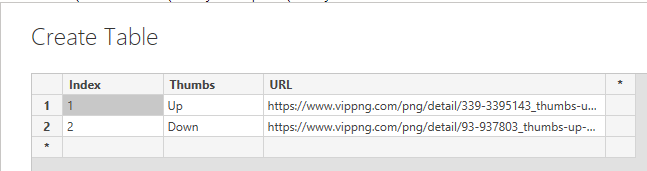
First parameter we want to fill, is whether the user likes the report or not. We will do that by using a thumbs up or down. These items are not yet in your Power BI dataset, but you can easily add them by adding a new table to your datamodel. Just click Enter Data in the top ribbon in Power BI desktop and create and your table.
In this example, I also added two URLs which I will use later to show in the slicer, instead of showing text. These images represent thumbs up / down.
Collecting a numeric rating
Another thing we want to setup, is a range wherein the user can provide a numeric rating to our report. We will do that by using a What If Parameter in Power BI. This option can be found in the modelling section of the top ribbon. The option is called New Parameter.
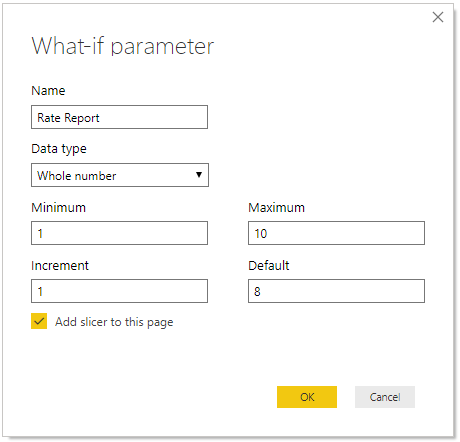
We want to provide a rating between 1 and 10 for our report with increments of 1. Besides that, we obviously think that we are doing a good job, so let’s set the default value to 8. As soon as we click OK this will add a new DAX table to our datamodel as well as a slicer to our canvas where the user can select a rating.
Bring things the variables together in a measure
Currently, we have two things available. Other things such as the user, datetime and report name will be part of the measure we are about to create. This new measure also needs the HTTP GET URL as provided by Microsoft Flow in the first step.
The URL provided, is a very long unreadable URL. Please copy this URL to a notepad or other text editor and notice that you will see all the parameters defined in this URL. You will also see the curly brackets in there which we will be replacing soon in the measure in Power BI.
Let’s create a new measure in Power BI and work with some variables. First, we setup the following variables to get all data available to fill our parameters:
- ReportName, here you can hardcode the name of the report as text.
- TimeStamp, here we will retrieve the current date and time at trigger moment. We can do this by using the DAX expression NOW( )
- User, this will help us later to identify the user who provided the feedback. Since this report will be shared and viewed from the Power BI Service, we want to extract the logged in user. We can do this by using the DAX expression USERPRINCIPALNAME( )
- Thumbs, here I will retrieve the selected value (eg. thumbs up or down) from the slicer. As you might have noticed, I included an index value in the earlier created table for thumbs up or down. This is the value I will use here. Here I use the DAX expression SELECTEDVALUEto get the current value.
- RatingValue, last but not least, is the selected ratingvalue from the What If parameter. Here I used the same DAX expression as in the previous step.
After all these variables are set in the measure, the next step will be to concatenate all these variables into one URL. We can do this by using the CONCATENATE expression in DAX, but this only allows two parameters. Since we need to concatenate a lot of values, I’m using just a simple &, which covers the same functionality. My DAX will now look something like below:
Send Rating =
VAR ReportName = "ExampleReport"
VAR Timestamp = NOW()
VAR User = USERPRINCIPALNAME()
VAR ThumbsValue = SELECTEDVALUE(Thumbs[Index])
VAR RatingValue = SELECTEDVALUE('Rate Report'[Rate Report])

RETURN
"https://prod-05.westeurope.logic.azure.com/workflows/03238819664e4fb4984000ae21c708d8/triggers/manual/paths/invoke/"
& "/ReportName/" & ReportName
& "/Timestamp/" & Timestamp
& "/User/" & User
& "/Thumbs/" & ThumbsValue
& "/Rating/" & RatingValue
& "?api-version=2016-06-01&sp=%2Ftriggers%2Fmanual%2Frun&sv=1.0&sig=TDxyZBLLtNPYFpHkV2eLrvNVTNfUDPeJZPcQ18zJePo"
After creating this measure, please do not forget to set the Data Category for this measure to Web URL. You can do this by selecting the measure and go to the Measure Tools section in the top ribbon.
Since we brought everything together in a measure, this will be evaluated at moment of trigger. That means that the exact URL will vary based on the selected values for both the thumbs up/down and the rating slicer.
Send the data to Power Automate
Last but not least, is sending the data to Power Automate. Therefor we need something to trigger the URL, which we just concatenated in the measure. In the top ribbon, under the Insert section, we can find the option to insert a button.
The button can be customized with text and hover over colors in the format pane. More important is assigning the measure to the button. You can do that with the below steps
- Select the button and go to the format pane.
- Go to the Action section.
- Set the type to Web URL.
- In the box for Web URL, do a right click and the fx conditional formatting option will pop-up. Please select this one.
- In the pop-up window, select the previously created measure and click OK. Please notice that if you can’t select the measure, the Data Category for the measure is not set correctly to Web URL.
After this step we are ready for testing! When we click the button, a webpage will appear showing the text we entered in the second step of the flow. Just a simple blank page showing a text. Showing this page, identifies that the Flow in Power Automate was triggered successfully.
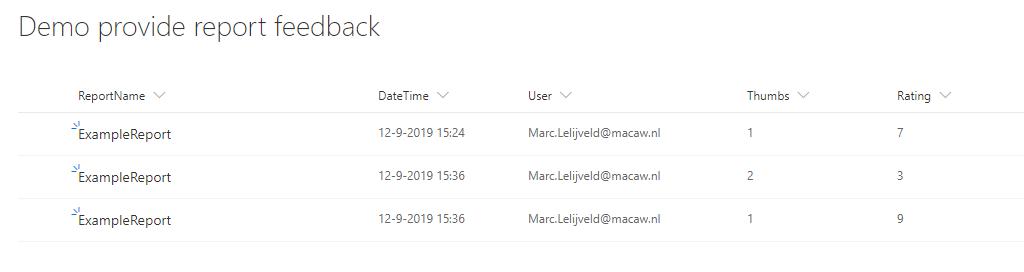
In the below screenshot you can see three entries in the SharePoint list showing the incoming data. I have chosen to use the index value for the thumbs up/down value (eg. 1 = thumbs up, 2 = thumbs down). You can use text here as well, as long as it is pre-defined and available to select in a slicer.
You can make it as advanced as you want. in the below example, the rating features are hidden by default and only shows up when the user clicks another button to provide feedback. This can be done with bookmarks.
I have created a very simple setup as well as a more advanced setup in an example report. You can download the example report from my github repository.
Wrap up and remarks
This easy setup can be a valuable and low-level way to collect feedback over a lot of reports. This will help you to get a better understanding whether your reporting audience is happy with the insights provided.
Unfortunately, this setup does not allow you to fill in text. There is no way in Power BI where users can enter text. One option to let your users enter text could be the use of a Power App. However, this setup requires a lot more effort which might not be a good business case. On the other side, maybe adding text is also not what you want. The current setup will give you a first impression on the satisfaction of your reporting audience. If you let users add text, this will cost them more effort, with a possible drop-out. Personal contact is also still an important factor. So, based on the first impression you can contact the user who provided the feedback to let them elaborate on their feedback.
The setup described above is just an example with thumbs up and down, but let’s get creative! Use emojis or something else!

Not to mention the fact that Power BI usage metrics are based on what the end-users browser is sending to Microsoft… Some ad-blockers will prevent recording usage statistics.
LikeLike
Hi Marc,
Great stuff! I actually have this working – thanks to you! However…. the user is left with a mostly blank web page and the URL exposed. I wish there was a way to close that browser tab right away. Do you know how that can be done? Inject some JavaScript maybe? I tried playing with “Add dynamic content” but no luck so far. Thanks again, Greg
LikeLike
Hey Greg,
That was unfortunately one of the less fancy parts about this solution. You can further customize the page in the Logic App if you want to get rid of the blank page. Other than that, there is currently not an option to directly close the browser tab as far as I know.
But… there is something cool upcoming! A Power Automate visual is coming soon (planned for October). I expect that similar things will be possible with this visual.
See the release plan here:
https://docs.microsoft.com/en-us/power-platform-release-plan/2020wave2/power-bi/power-automate-visual
Cheers,
Marc
LikeLike