
Already the fifth week in a row posting a blog! A new record for me! This time it is all about ensuring a consistent context. The fifth blog out of seven as part of the storytelling blog series. In this blog I will highlight two features in Power BI which will help you to set the context. One of these features is already discussed in the first blog, which is the data property of bookmarks. Next to that, Sync slicers is also an important feature to help you in ensuring a consistent context.
Consistency
Thinking about consistency, some words which pops-up in my mind are equality, similarity and same. So, it is all about making sure that what we present, matches the end-user’s expectations. In reporting and dashboarding consistency can have many different meanings. Below some listed and shortly described;
- Lay-out, make sure all your visuals have the same formatting, colors used, font, font size and many other things. This can be done easily by applying a theme to your report. More about themes can be found in this Microsoft documentation about using and creating themes.
- Terminology, make sure everyone is on the same page when they talk about the report. Also look at common terminology within the organization. Make sure the terminology is consistent across your report. For example, do not mix the abbreviations PY and LY. In other words, prior year and last year. Pick one which matches the end users’ expectations.
- Use the same date dimension across all your visualizations is a completely different application of consistency. Date dimensions can differ based on regional settings or language settings. When it comes to data modelling, implement your own date dimension and always use the same in reporting. Reza Rad wrote a blog on how to create a date dimension.
- Filter context is the last, but maybe the most important one. If you have applied filters on page one, and navigating to another page, you want the filters to remain the same.
A few important things when talking about consistency in reporting. In this blog I will go further in detail on the last bullet about filter context.
Where it goes wrong
During my webinar about Storytelling and interactive reporting, I showed an example where the consistency wasn’t applied right. Let me shortly explain this example.
In the below report you can easily click on a country on the left side to move to another page. When it comes to interactivity it is all done right! On the right top you can also filter on order date. Let’s say we apply a filter to only see the sales up to the end of 2013. This results in a sales amount of nearly $ 319K.
Now, Germany gets my attention. I want to see more and decide to navigate to the other page by clicking on Germany. Ending up at the other page, I see that the sales amount changes back to $2.3M. In other words, my filter is gone!
The fact that the filter is gone, is caused by the bookmark. In the first blog about storytelling, provide an easy navigation, I explained everything about bookmarks. In this case, a bookmark is used to create a navigation to another page, but the data property isn’t set right. To keep the filter context, we should disable the data property. But that’s not all, we also need to sync the slicer over the pages.
Sync slicers
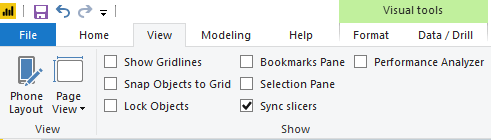
Power BI includes a feature where you can sync your slicers across pages. This feature can be found in the top ribbon under view. By enabling the Sync slicers pane, you won’t see anything yet. You need to select a slicer on your canvas to make this work.
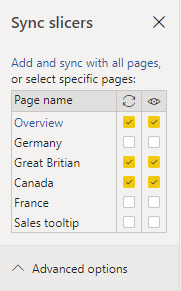 After selecting a slicer on your canvas, you will see multiple properties popping up. For each slicer you will be able to…
- …sync the filter context to each page you select.
- …show the slicer on each page you select.
Besides these two properties, there are also advanced properties which allow you to create a group of slicers to keep synchronized. This will make it easier than maintaining all the slicers one by one. Don’t forget to give an explanatory name to the slicer group.
Make sure you check your bookmarks as well before testing it. When the data property of your bookmark is still enabled, this will overrule your sync slicers properties. If you use the bookmarks only for navigation between pages, always disable the data property!
Inform you user about the current filter context
Maybe you don’t want to show your slicer on each page, but you do sync the filter context. In that case, your end user might get lost on where he or she is looking at. So, make sure you always inform your end-user on the current filter context. You can do this in multiple ways:
- Use the default visual header on top of every visual. This will show the applied filters to that specific visual. I explained this feature in more detail in my blog about having an interactive experience.
- Use a DAX expression to collect the current filter context and show this on a card on the page. You can do this by using the SELECTEDVALUE expression. This approach can result in a lot of work, since you need to create an expression for every possible filter to get the filter context. With SELECTEDVALUE you can show the end-user the applied filter, another option could be to use ISFILTERED expression which only results true or false depending on if there is a filter applied.

Pingback: Storytelling with Power BI: Consistency – Curated SQL
Pingback: Webinar recap & blog series: Storytelling & interactive reporting with Power BI – Data – Marc