
Have a guided experience, my third blog as part of my blog series regarding Storytelling with Power BI. During this blog series, I will elaborate on seven topic which can be used to apply storytelling features to your own reports.
A guided experience has a lot of similarities with the first blog in this series, provide easy navigation. That blog was all about how to build your navigation by using bookmarks. This blog will be more about why it is important to have your navigation on point.
Define your type of storytelling
While building your report, think about what information you want to transfer to your end user. Typically, it all starts with a business requirement, where you’re asked to build a report to answer their question. Before you start building you report, define your type of storytelling by choosing one of the below options;
- Descriptive reporting is presenting facts to your end user, without any explanation. Just reporting and presenting on the facts. Descriptive is used a lot to answer questions like who, what, where, when + your research questions where your data is about. For example, what are my sales numbers for the current year. You simply present the numbers and answer the business requirement.
- Declarative, reporting on what happened and why it happened. For declarative reporting, it is most likely you start with some descriptive insights, followed by reasoning why it happened. Picking the same example as above, you’re not only reporting on the sales numbers for the current year, but also why they are behind or above budget. With declarative reporting you’re taking the next step and providing the end users with substantiation with the facts presented.
- Exploratory, this type or reporting doesn’t sum up to a conclusion up front. You’re providing a lot of insights to the end user which allows him/her to explore the data themselves. Typical for this type of reporting is using more data from different sources and providing them more information than they asked for. The end user has to come to a conclusion themselves. As an example, I will use the same business requirement about current year’s sales numbers. With exploratory reporting you will provide insights on sales numbers, but also more detailed information from your CRM system, and some data which might be of an external influence. For example, numbers of employees in the organization. Maybe you will end up with the conclusion that your sales numbers are behind budget because people in the sales department have resigned.
By picking one of the above types of storytelling, you know where to start building and start collecting the data you need for that. But before we start building visuals, we need to think about the interactions as well.
Click path
Another thing to think about before building visuals, is the click path. In order to make sure we’re really telling the story, we need to get our click path in a logical order. This is most important for both, declarative and exploratory storytelling.
Maybe you want to provide all the information in your visuals right away. Sometimes I see things like this happening when people add a lot of visuals on only one page. In my experience it is better to make your report interactive and work with multiple pages. Spread the story you want to tell out over multiple pages. This is what Will Thompson also has done as well in this report for the Gartner Bakeoff in 2018.

Look at the navigation on the left side of the report. The pages are in a logic all order of the story Will wants to tell us. First, he start with where this report is all about, the Opiod crisis. Next follows a media discussion which is setting more context around the topic and defining the importance. As third topic in his story, he is providing more detailed information, where it was more high-over on the first page. As last part of his story, he created the call to action.
These four steps in the story Will tells us, begin with introducing the topic and providing high over information. Step by step he is giving us more context and convince us to take action. A logical and even structure of the story.
Draw your story line
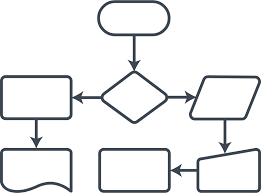
What might be of help, is to draw your story line before start building your report. I do this myself more and more often, because it helps me in building an intuitive report. I mostly do this by simply drawing a flowchart on a piece of paper or a whiteboard. By drawing the flowchart, every page is one object where I set the context around by defining if this page is more high-over, or detailed information.
Based on the type of storytelling your defined upfront, you can have multiple routes which lead to the end page. Most likely you will have one straight flow from beginning to end for both descriptive and declarative storytelling. Since the end user has to define the conclusion themselves for exploratory storytelling, you might have some choices where the end user might take another route.
You need to lead the end user through your report!

Pingback: Guiding Your Users with Power BI – Curated SQL
Pingback: Storytelling with Power BI 4/7: Have an interactive experience – Data – Marc
Pingback: Webinar recap & blog series: Storytelling & interactive reporting with Power BI – Data – Marc