
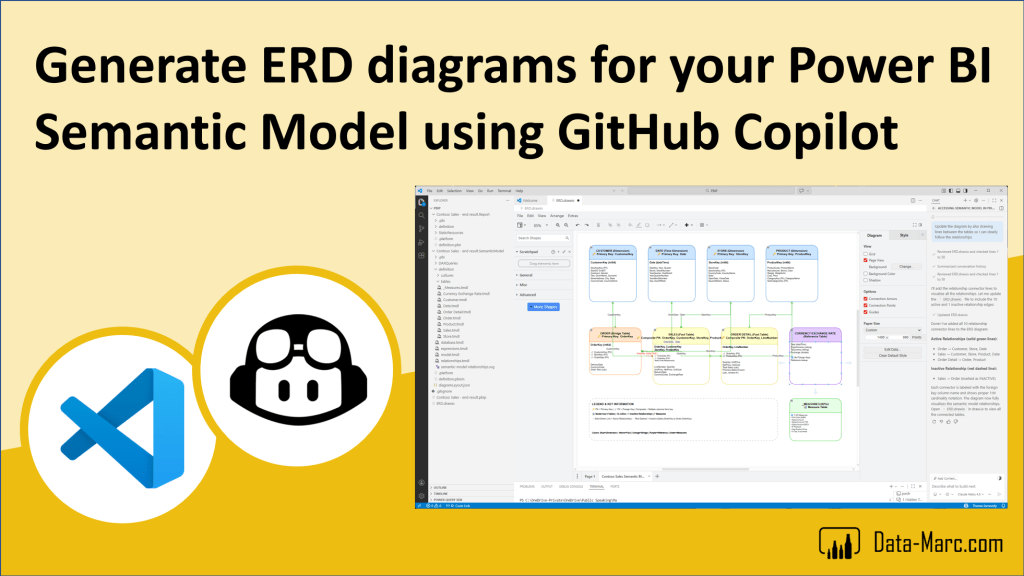
While preparing for a training day I will host early March, I was doing some experiments in VS Code with GitHub Copilot and a few related extensions. Nothing fancy at first, just exploring what is possible when working with Power BI Projects outside Power BI Desktop.
One thing I quickly missed was the visual overview of the semantic model. In Desktop you get a clear relationship view, but once you switch to project mode you mainly work with files and metadata. So I started wondering if I could generate an ERD of the semantic model directly from those files.
A few prompts later I had a fully editable ERD in a draw.io file. Not a static image, but something I can actually maintain, adjust, and reuse. That turned out to be more useful than I initially expected.
In this blog I will walk you through what I did, what worked, and how you can generate a similar ERD yourself from a Power BI Project.
Setting the goal
When working with semantic models in Power BI Desktop, you get a clear visual overview of tables and relationships out of the box. That makes it easy to understand how a model is structured, validate relationships, and explain the setup to others.
The moment you switch to a Power BI Project and open it in VS Code, that visual layer disappears. You are mainly working with metadata files, which is great for version control, automation, and collaboration, but it does make it harder to quickly grasp the model structure. I wanted a visual representation again, without having to go back to Desktop every time.
That is where the idea for this experiment started. I wanted to see if I could generate an ERD from the semantic model files directly. An ERD, short for Entity Relationship Diagram, is essentially a visual representation of tables (entities) and how they relate to each other. It is commonly used in database design, documentation, and architecture discussions and reminded my back to my bachelors where we had to design ERDs on a piece of paper. Right now, lets see if we can generate is using AI for the sake of understanding structure and validating design choices of our semantic models in a Power BI Project.
So in short: the goal of this experiment was simple, create a repeatable way to generate an editable ERD-style diagram of a semantic model directly from the project files, without relying on Power BI Desktop.
The tools
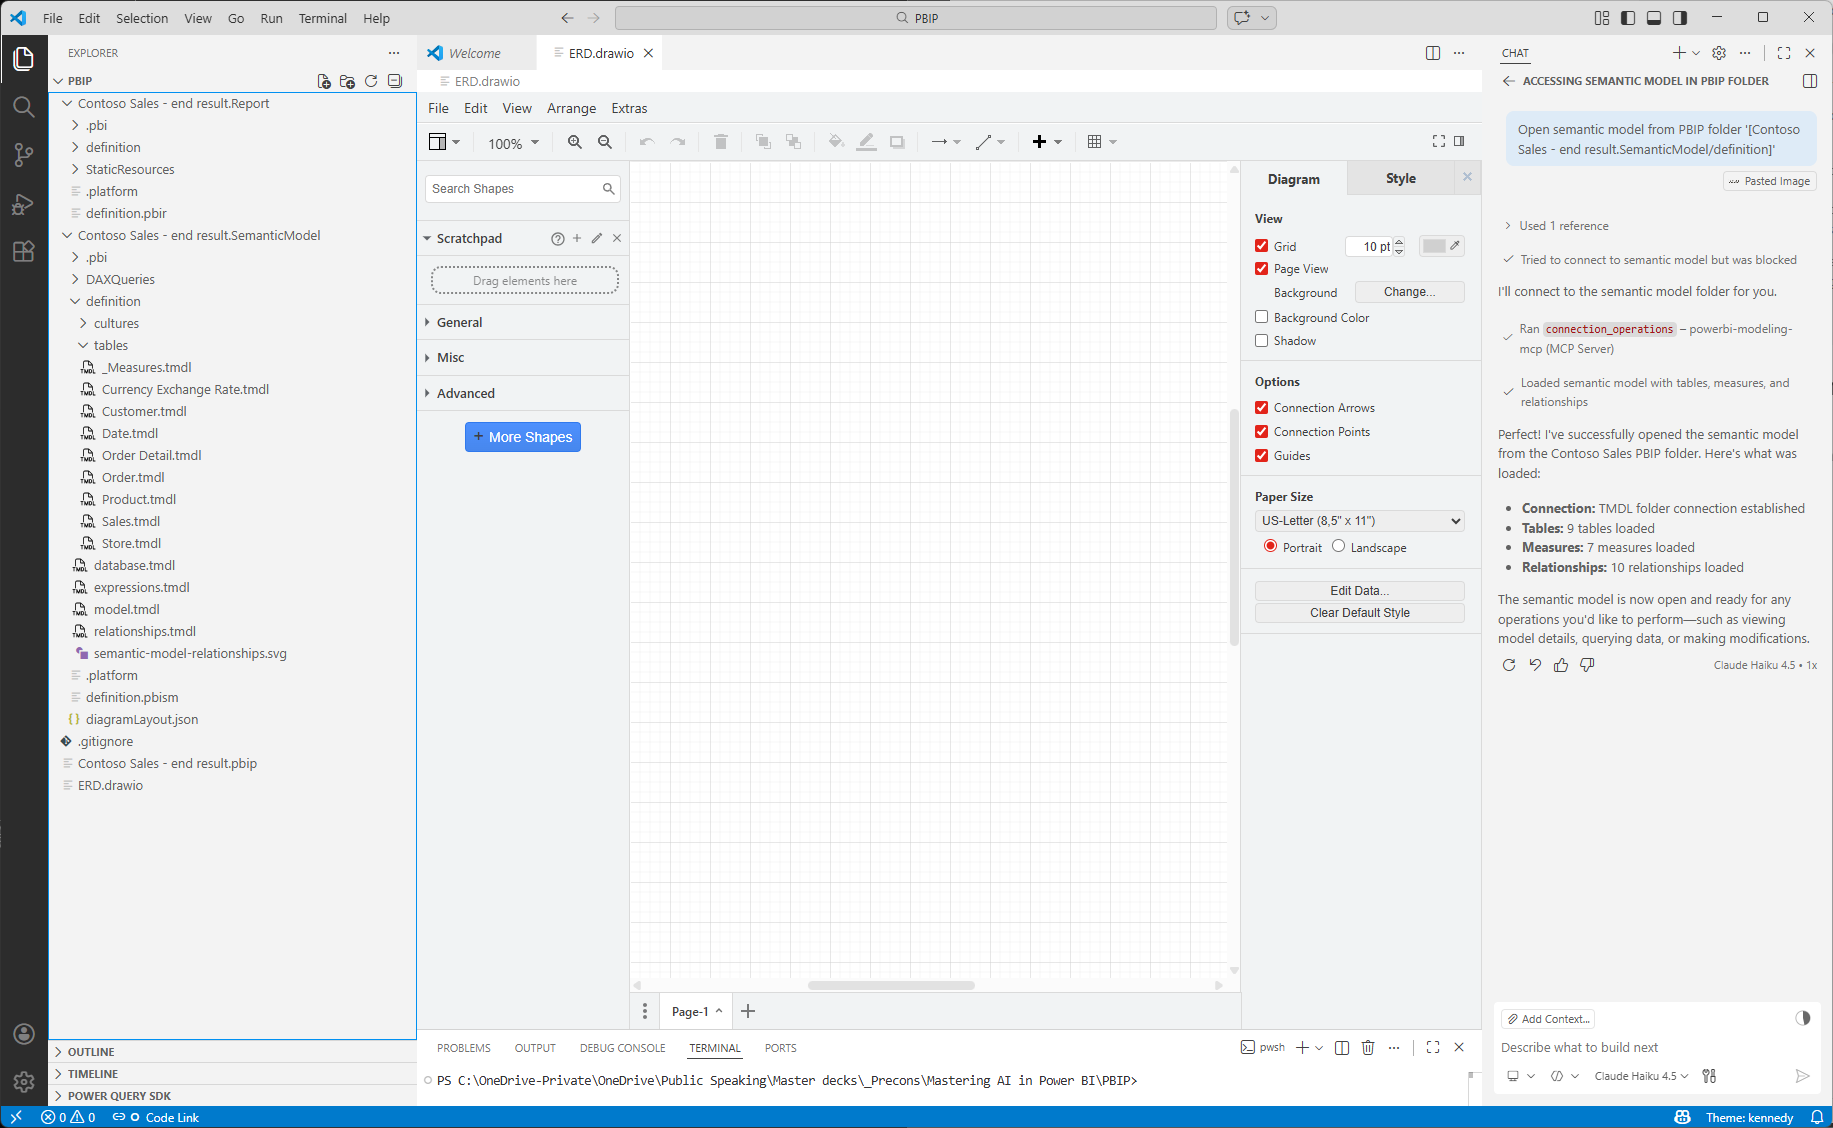
I used several components to get the solution to work. First of all, I made sure my Power BI files were saves as Power BI Project (*.pbip) in the folder structure. That folder, I opened with VS Code to get an overview of all the files that form the total solution.
Also, several extensions in VS Code helped me to generate the results:
These extensions together helped me first to read and understand the structure of the TMDL files, which are part of the Power BI Project. Also, the relationships between the different files are important to grasp. That’s where the Power BI Modeling MCP Server extension came in.
Lastly, in my first tries, it generated an SVG and later a PNG image. These were static and not well organized, to say the least. Below you see an example of the first results. Not really what I was looking for! (Let’s just conclude it was messy!)
Then I thought, usually when I generate architectural designs, I use draw.io. Why not use draw.io in this scenario to generate the ERD schema for me? Below I guide you step by step through the steps I took to get to the final result!
To help generate that visual representation I experimented with GitHub Copilot in VS Code to translate model metadata into something visual. The diagram itself is generated as a draw.io file using diagrams.net, which keeps everything fully editable afterwards. That was an important requirement for me. I did not want a static export but something I could continue refining.
Note: In below step-by-step guide, I expect you already installed the earlier mentioned extensions. I will not go through the process of installing them.
Step 1: Save as *.pbip
As I briefly mentioned before, make sure you save your Power BI solution as a Power BI Project. Pretty straight-forward by doing a save-as from Power BI Desktop and choose the destination of your liking.
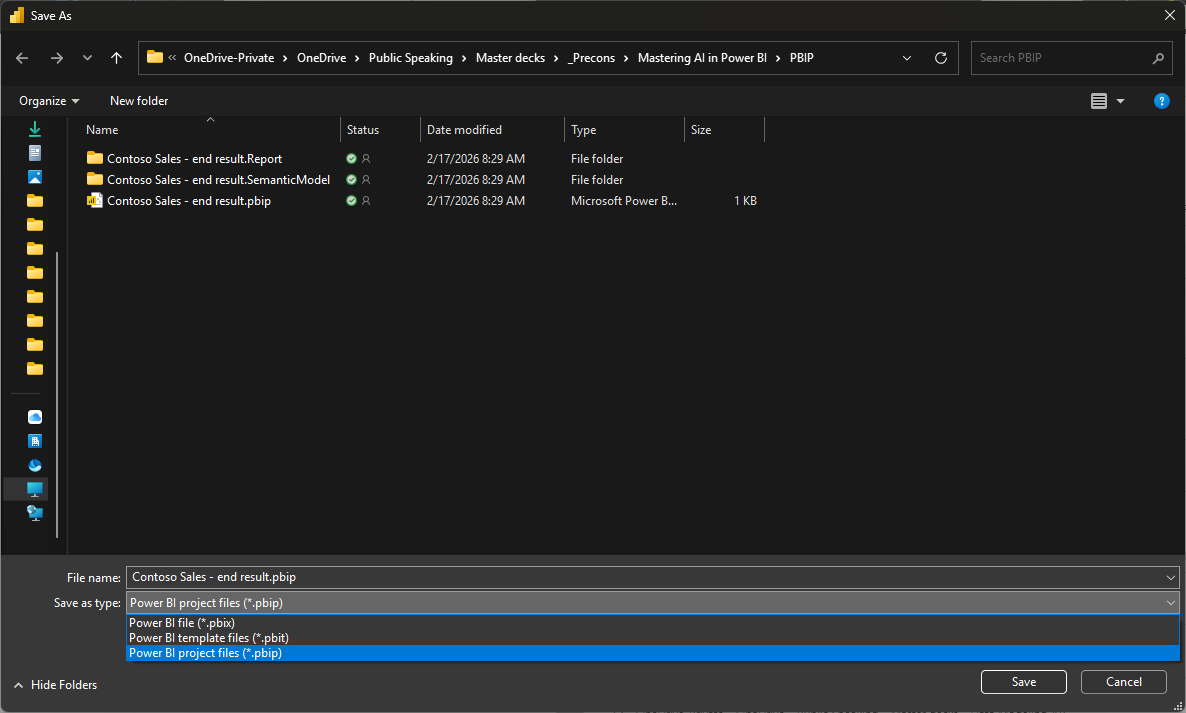
Remember that you may need to enable some preview features related to the Power BI Project file structure. You can find more about it in this documentation.
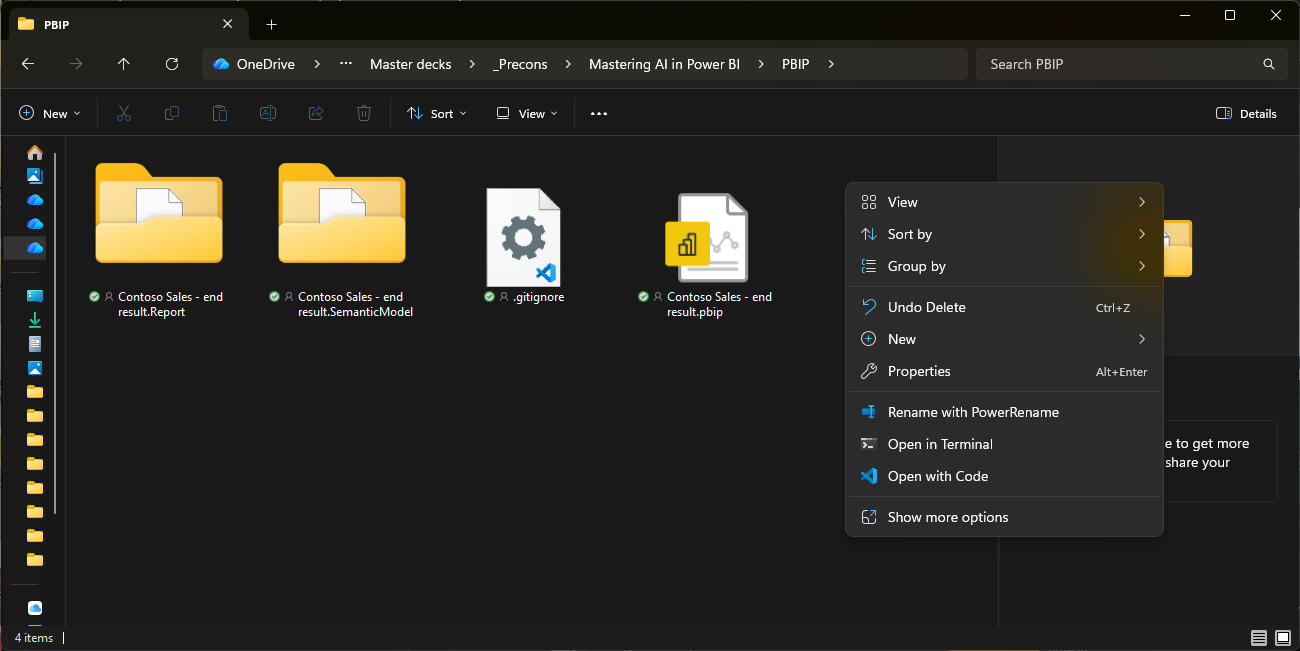
Step 2: Open in VS Code
Navigate to the file location where you saved your Power BI Project. From there, do a right-click to open the folder structure in VS Code.
Step 3: Open the Semantic Model structure in the GitHub Copilot chat
I used GitHub Copilot to generate the diagram (be aware you need a license for this). As a first step, following the guidance of the Power BI Modeling MCP, I have to connect to the folder structure where my *.tmdl files are located. I did that using the following command:
Open semantic model from PBIP folder ‘[Contoso Sales – end result.SemanticModel/definition]’
In this setup, you have to make sure you refer to the exact folder structure that matches your solution. In the definition folder and subfolders, you will find all the *.tmdl files, including the tables and the relationships.tmdl file. After this prompt, you will see GitHub Copilot rambling on for a moment to read all the files in the directory. You may need to click “allow” a few times.
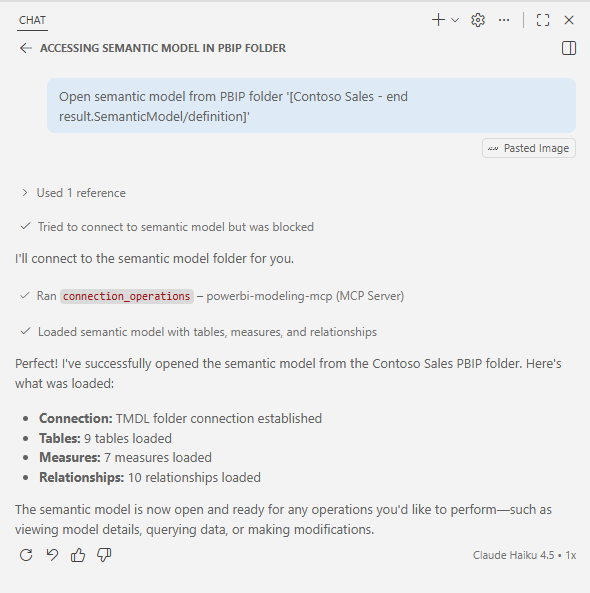
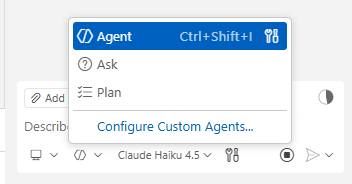
Also make sure you set the GitHub Copilot chat window to Agent mode, so it can generate files in the folder structure on your behalf.
Step 4: Add an empty draw.io file to the solution folder
As we want to generate the fully interactive and dynamic ERD diagram, we will use draw.io. To do so, I manually added a file to the root of my solution in the left-hand menu of VS Code. I called the file ‘ERD.drawio’. New files can easily be added by doing a right-click in the folder structure.
After the file is created, you will see (if you installed the extension correctly) a new editor opening in VS Code. This is the empty diagram.
Step 5: The final prompt!
Last but not least, is the final prompt in which you instruct GitHub Copilot to generate your ERD file. Keep in mind that a good prompt follows roughly the following formula:
Role + Context + Task + Output format
I used the following prompt to let it generate the ERD, following above principle:
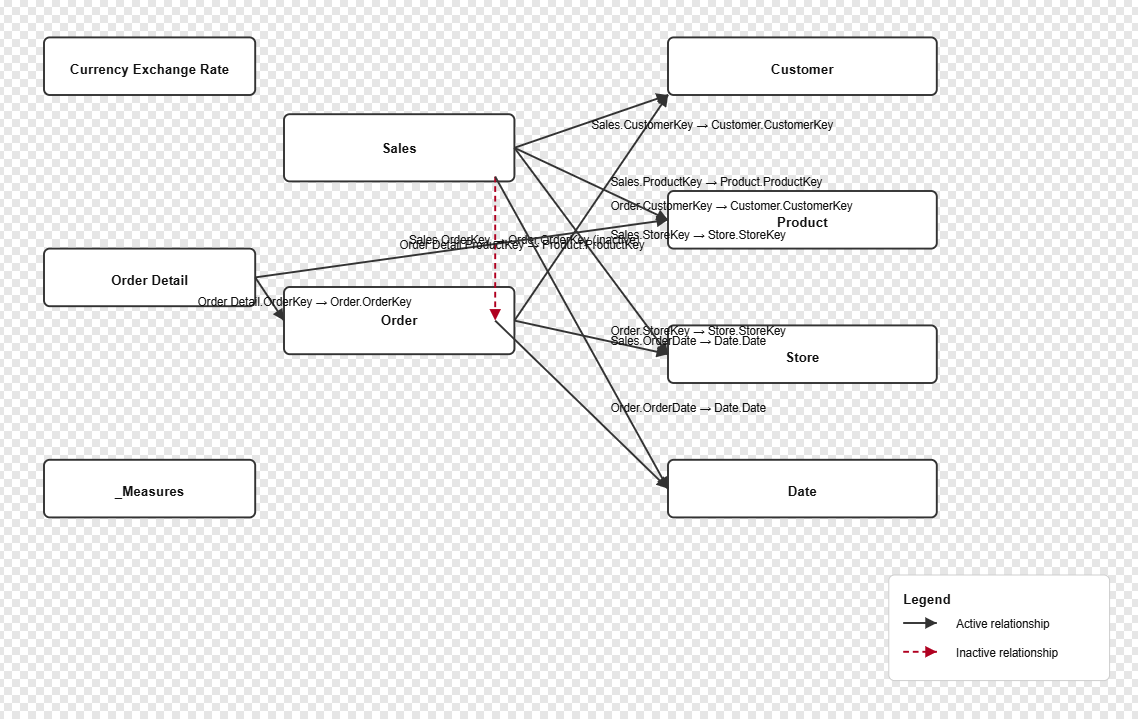
As Power BI Developer, it is important for me to understand the semantic model relationships and how different tables are connected through different types and directions of relations. Have a look at the ‘relationships.tmdl’ file and generate an ERD diagram in the ‘ERD.drawio’ file. Make sure the ERD includes all tables and columns of the semantic model and clearly flag which columns form the relationship, primary keys and foreign keys.
After this prompt, you will see GitHub Copilot rambling on for a moment again, while it is reading all necessary files and starts generating a new tab in the ERD.drawio file. As it is the nature of a LLM to not always come back with consistent results, you may need to add a few more prompts yourself to correct the results. But at least, it does a good job of understanding the semantic model and it’s structure already in the answer it returns:

Personally, I’m genially happy with the outcome and the diagram it generated:
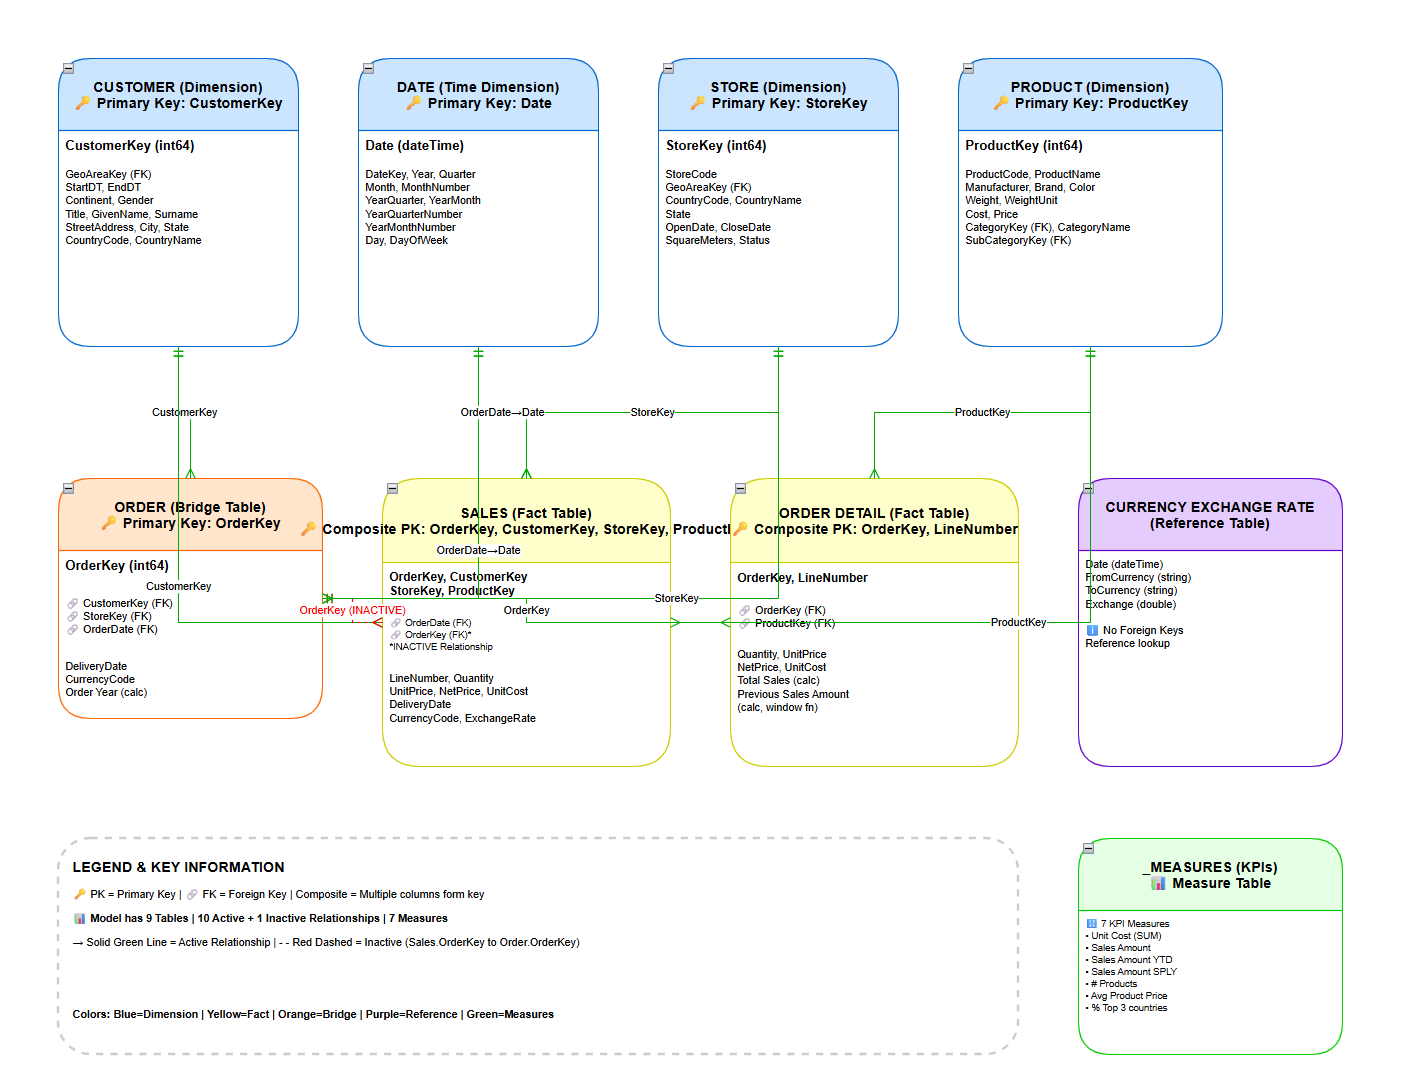
You may argue that the lines forming the relationships between the tables are not all as easy to follow. But luckily the draw.io file is fully interactive so I can easily drag-and-drop the tables around to my liking. Especially since different best-practices exist around how the star schema should be displayed. Like all dimensions on top, to the fact table in the middle surrounded by the dimensions. Whatever is your preference, either drag-and-drop them around yourself, or give it another prompt!
Wrap up
All in all, this was one of those experiments that started as a simple curiosity and turned into something genuinely useful. Being able to generate an ERD directly from a semantic model in a Power BI Project removes a small but real friction point when working outside Power BI Desktop. It helps with documentation, model validation, knowledge transfer, and honestly just understanding your own model faster.
What I like most is that this is not a fixed export. Because the diagram is generated as a draw.io file, it stays fully editable. That means you can refine layouts, add context, or adapt it to your own modeling conventions without starting from scratch.
Using Microsoft tooling like Visual Studio Code combined the necessary extensions plus GitHub Copilot also shows how AI can support practical day-to-day tasks, not just code generation but also documentation and model understanding. It is not perfect every time, and sometimes you need a few extra prompts, but it gets you surprisingly far very quickly.

So if you update your model, like adding a new dim table or similar – will the diagram be automatically updated, or will you have to go to the prompts again to generate a new drawio file?
BR,
Domantas
LikeLike
The draw.io file in it self will not update automatically. A simple prompt to update the diagram will suffice, see it as writing your documentation, but then much easier and faster!
LikeLike
Took a bit of fine tuning and further prompting to get the diagram accurate or solve correct creation & formatting of the table defintion shapes, but this is handy approach to streamlining model documentation beyond just screenshotting model view.
Once the refinement instructions are done, recommend creating an instruction doc which you can feed to agents in the future, so you’re not repeating all the tweaks!
LikeLike
Awesome to hear Jack! What prompts did you use for finetuning?
—Marc
LikeLike
Had issues where the table’s non PK/FK columns were all on one row in the visual, with ` | ` seperators, so think the agent got confused between markdown syntax and drawio syntax, which might be my directory context, or just bad luck with agent temperature.
Because I had the instruction file, it was a bit easier to regenerate than just going “no, this is wrong, try again” or reseting the agent context and trying again.
The AI generated instructions (for itself) were pretty good. Added some extra stuff around putting Calendar table relationships onto a second diagram which Ive yet to test. Always make a 2nd ERD view in PBI desktop for that, given dates can get messy!
LikeLike
Hi Jack,
Thanks for your comment. Instruction files indeed work really well. I assume you used a markdown file in the same repository? I like the idea of putting the calendar / date table in a separate diagram, especially as that usually has many relationships – both active and inactive.
–Marc
LikeLike
Very cool, Marc! And really great in an enterprise GIT setup for documentation.
Did you find a way to have a similar interactive model ERD, that can be used within Power BI thin reports that is end-user friendly? I have tried with different combination of the Force-Directed Graph visual and Deneb, but I did not manage to create a proper one.
LikeLike
Hi Thomas,
Thanks for the nice comment. Unfortunately, there is no out-of-the-box solution for thin reports. Simply because the semantic model doesn’t live in the PBIX / PBIP file at that moment. The connection between the report and the semantic model is a secured connection, which is not open to chime in and generate an ERD like this. This is blocked from a licensing perspective as far as I know.
–Marc
LikeLike
Nice concept, but did you ever try this in a real-life prod scenario (dozens of tables, multiple relationships of different types, etc.)? I’ve done so and it doesn’t work at all.
Nice proof of concept but AI still fails when things are not “by the book”.
What worked in my experience is PBIP-Documenter from MVP JIHWAN KIM
No AI (=plus-or-minus-educated guesses) involved, only rules-based pure scripting.
PS: commented with disposable email.
LikeLike