
There are loads of default semantic models and reports provided within Microsoft Fabric and Power BI. Take for example the capacity metrics, or all reports made available in the Admin Monitoring Workspace. However, all these solutions come with the same downside, being the data is available for a very short timeframe only. Capacity metrics only look at the past 14 days, where Admin Monitoring reports contain data for the past 28 days.
There has been a big ask, including from myself, to collect this data and store it for long term analysis. Microsoft will not provide us that option unfortunately. However, there is an option! In this blog I elaborate on way to collect data from any semantic model you have access to and store it in your own Fabric lakehouse.
Challenge
Many semantic models and reports provide insights in for example Fabric and Power BI usage, governance, or things like capacity performance and utilization. These reports are provided out of the box by Microsoft but come with one significant limitation. Data is only available for a limited timeframe. As administrator of the tenant or owner of the report, there is no option to extend the data retention and keep it in your own control. However, there is a desire to store data for a longer timeframe. Let’s have a look at typical use cases.
Capacity metrics
“The Microsoft Fabric Capacity Metrics app is designed to provide monitoring capabilities for Microsoft Fabric capacities. Use the app to monitor your capacity consumption and make informed decisions on how to use your capacity resources.”
The capacity metrics report only provides data for 14 days. However, ideally you store data for a longer timeframe. Typical use cases could be cross charging on monthly bases or analyzing utilization trends over multiple months or even years for specific solutions. Like is my solution increasing in capacity utilization, or maybe it’s just stable? Probably there are many more cases in which you require a longer retention than only 14 days.
Admin & monitoring workspace
“The admin monitoring workspace is a specialized environment designed for Fabric administrators to monitor and manage workloads, usage, and governance within their tenant. Using the resources available within the workspace, admins can perform tasks such as security audits, performance monitoring, capacity management, and more.”
Today, the Admin Monitoring workspace comes with two focus areas each represented in its own report.
- Feature usage & adoption
- Content sharing report
Each of these reports have its own semantic model which stores data for 28 days. So, almost a full month of data is provided. But especially when it comes to governance but also usage and adoption you likely want to trace those stats for a longer timeframe than only 28 days. Like, monitoring platform adoption as a whole for a year.
Moving towards a solution
All by all, we just want to store the data and keep it in our own control. However, the semantic models containing this data are secured. Even as administrator, you cannot change the definitions of the semantic models. And we all know, exporting the data to Excel is not really a good practice – right? We may even loose a certain level of detail as aggregated data, or an incomplete set may be exported. So, what alternatives do we have?
At first, I started looking for solution that collect data from an existing semantic model. Options like the Execute Queries REST API came to mind. However, that option still comes with many limitations like the maximum number of rows (100k), values (1M) and total data size of 15 MB. Also, defining your own DAX expression to extract the data, requires a good understanding of the semantic model, structure and relationships.
The second option I looked at, was using Semantic Link (Labs) to query the data in the semantic model directly. Semantic Link allows you to interact with semantic models from a Fabric Notebook perspective. Querying data as well as meta data should be possible, amongst many other options. However, I quickly run into a wall, as the out of the box semantic models for Capacity Metrics and in the Admin Monitoring workspace are in a protected state which blocks interaction like from Semantic Link to extract data.
The magic trick!
Moving forward, I will use the Feature Usage and Adoption report from the Admin Monitoring workspace as example.
However, as I must be the owner of a semantic model to interact with it and extract data from it using Semantic Link, I quickly found a work-around which got it to work for me. I simply created a new semantic model, which creates a direct query connection to the Feature Usage and Adoption semantic model – a so-called Composite Model. You may think, yeah sure – a composite model only passes through the queries, but I still have to deal with the limitations in data retention. And you’re absolutely right!

After making the composite model available in a workspace, as we set it up in Power BI Desktop, we are the owner of the semantic model and can do whatever we want with it. Long story short, we can now use Semantic Link to extract the data.
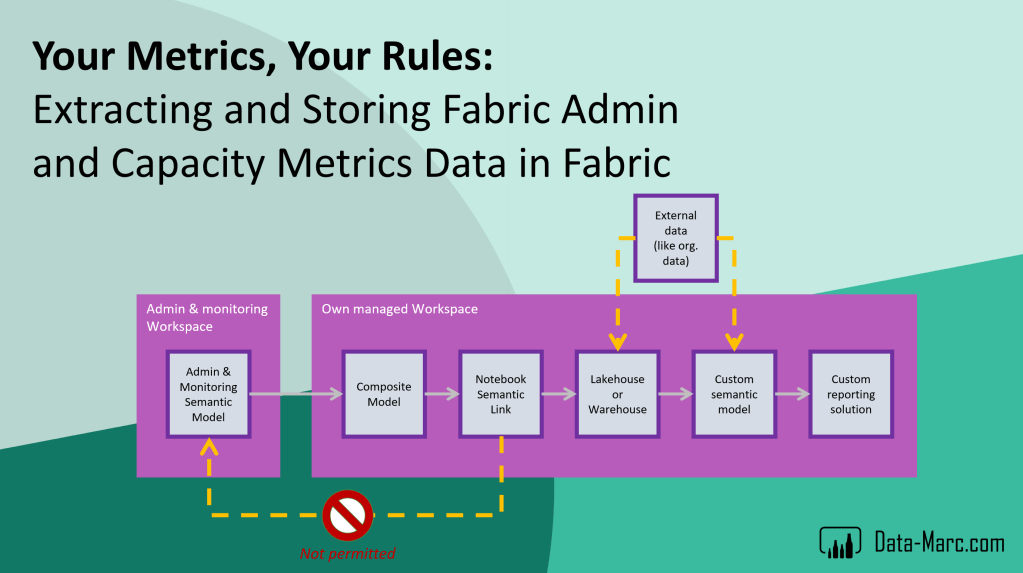
What effectively happens, is that we will interact with our notebook using Semantic Link with our just created composite model. From there, the query will be passed through to the Feature Usage and Adoption semantic model over a DirectQuery connection. Results will be sent back, and we can store them in a lakehouse, warehouse, database or any other storage we prefer.
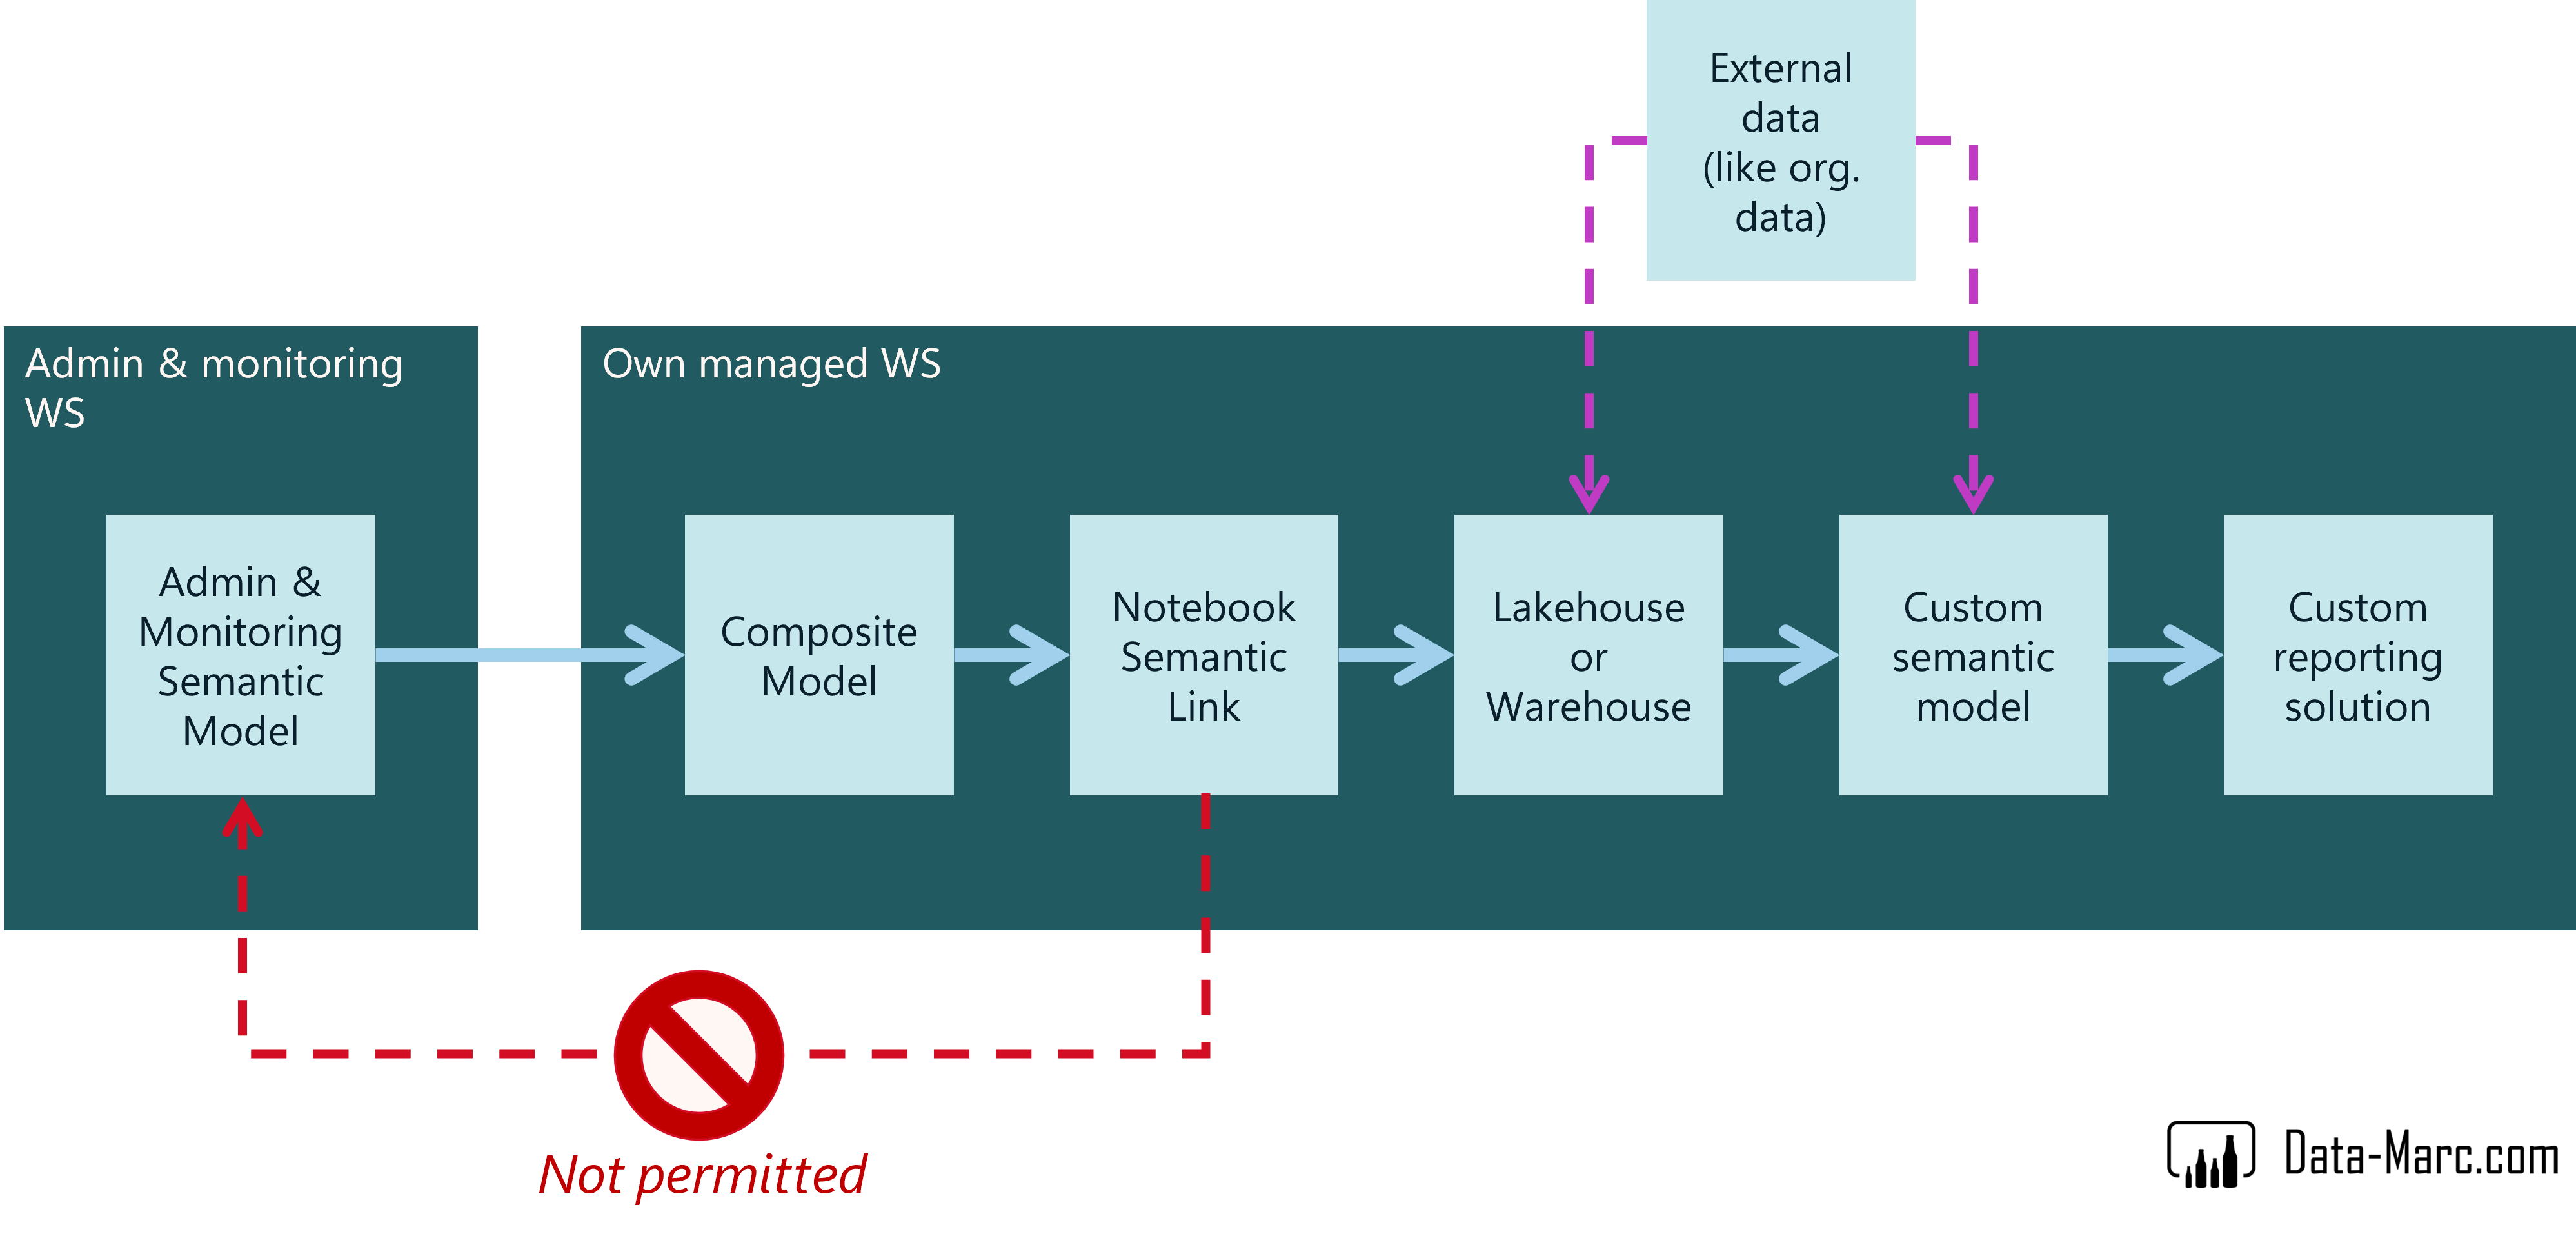
High-over, the above image shows the setup we end-up with. We can enrich the data to our liking in the lakehouse or warehouse, as well as a new (custom) semantic model on top for our own long-term analysis. Typically, you can add things like your organization structure, cost center structure or anything else.
The Notebook
So far, I mainly described a theoretical story. To help you getting started, I provided the notebook to do this trick (just extracting data from a semantic model) in my GitHub repository. Use this as your starting point, but I don’t anticipate this to be the perfect solution.
Perfect yet imperfect
There are aspects in this solution that you must be aware of. Below a list / summary of things to keep in mind and I want to highlight before you get started.
- Semantic models often have use friendly names including spaces and/or special characters. Lakehouses don’t like them, therefore the notebook strips these characters from table and column names before saving it to the lakehouse.
- Some semantic models contain measure tables, a table only intended to store measures. These tables can be problematic to extract the data from a semantic model, as it can only work with tables that at least contain one row of data. In the notebook, I filter out table(s) with the name “_Measures” to not be included in the data extraction to prevent errors.
- Hidden tables are excluded from extraction as they are likely hidden for a reason. This can easily be enabled if you so desire.
- The script provided overwrites the data in the destination lakehouse. Keep in mind that you will NOT build up history in this way, as that requires you to choose append mode. You can easily change this yourself in the notebook, however – you may end up with duplicated data as the script will extract whole tables which may contain data from days you already have. Deduplication of the data is currently not captured in the script and is left for your enhancement. Especially looking at metadata, which may change over time (or consider slowly changing dimensions instead). This notebook does not deduplicate the data in the destination lakehouse.
- Comparison of data over a longer period of time may be at risk, as semantic model definition of the Admin Monitoring semantic model(s) may change through updates, which may break this data extraction notebook or provide data at different levels of granularity which makes data incomparable.
- Last but not least, querying such large volumes of data through a semantic model which effectively uses direct query, will have an impact on capacity. Consider and monitor impact before executing on large volumes of data.

Getting started
What I left up to you, is setting up a composite model, as you may desire to use a different source than the Feature Usage and Adoption report. Also, the destination (in my case a lakehouse) has to be created by yourself and is not automated. In the notebook, on top you can specify the names of the composite model and the destination lakehouse (pin it as default lakehouse to the notebook as well) which will then start working – as long as they are located in the same workspace.
Security risks
Finally, some security risks that I must highlight! Without spending too many words to it:
- The Admin Monitoring workspace is a workspace only accessible to the tenant administrator for a reason. So is the data stored in the semantic models in these workspaces. By extracting this data, you’re saving the data to a lakehouse outside of this security boundary. Be aware that certain data might be sensitive and requires careful consideration / additional security applied on top.
- Storing the data in the lakehouse that you control, makes you responsible for data retention and security following guidelines and principles applicable to your organization.
Wrap up
Long story short – the out of the box semantic models and reports from Microsoft, like Admin Monitoring Workspace or Capacity Metrics, provide useful information. However, often for a too short timeframe for long-term (trend) analysis.
Using the solution provided, it is definitely possible to extract data from the out of the box Microsoft semantic models. However, doing so comes with security risks and inconsistency if definitions change over time. An in-between step of a composite model is required to have sufficient access to run the notebook that extracts the data.
The notebook itself is not perfect yet, as it currently overwrites data and does not build up history. This has to be embedded in your own pattern and way of working with the notebook. The solution provided should not only work for the out of the box semantic models from Microsoft but is made generic and should work with roughly every semantic model to which you have sufficient access.
Finally, I want to do a shout out to Iqbal Khan – Senior Data Analyst at Microsoft. Together, we started discussing this approach at Power BI Next Step in September 2024, which has led to the session “Extending Fabric Monitoring for custom requirements” which we presented at the Fabric Community Conference in Las Vegas – March 2025. We put thought in this solution whether it would be feasible or not – and here we are.

Excellent, Mark! Thank you for your work on this and for sharing your notebook with us.
From what you have discussed and learned, is there a chance or roadmap that putting an API around these capacity metrics is anywhere on the roadmap?
LikeLike