
More often, people want to interact with their data in different ways than just a report. By popular demand, AI infused technologies are on top of the list. Customers are asking regularly if they can use Chat GPT on top of their own data, or similar experiences. Obviously, we will have copilot in list of options, but is it the way to go? Or should we consider alternatives like Power BI Q&A or Fabric AI Skills?
In this blog, I will elaborate on different Fabric related options that allow you to build natural language solutions on top of your own data.
Natural language querying
We’re living in a busy era in which we require just in time information. The information must be served to us in the place where we are, the technology we use and device we’re on. Without further elaborating, this means reports and dashboards might not fulfill our requirements. Maybe even, the report might not give the insights we’re actually looking for. The ask for ad hoc insights could be fulfilled by an analyst in your organization, but will that be just in time? Or should we move faster?
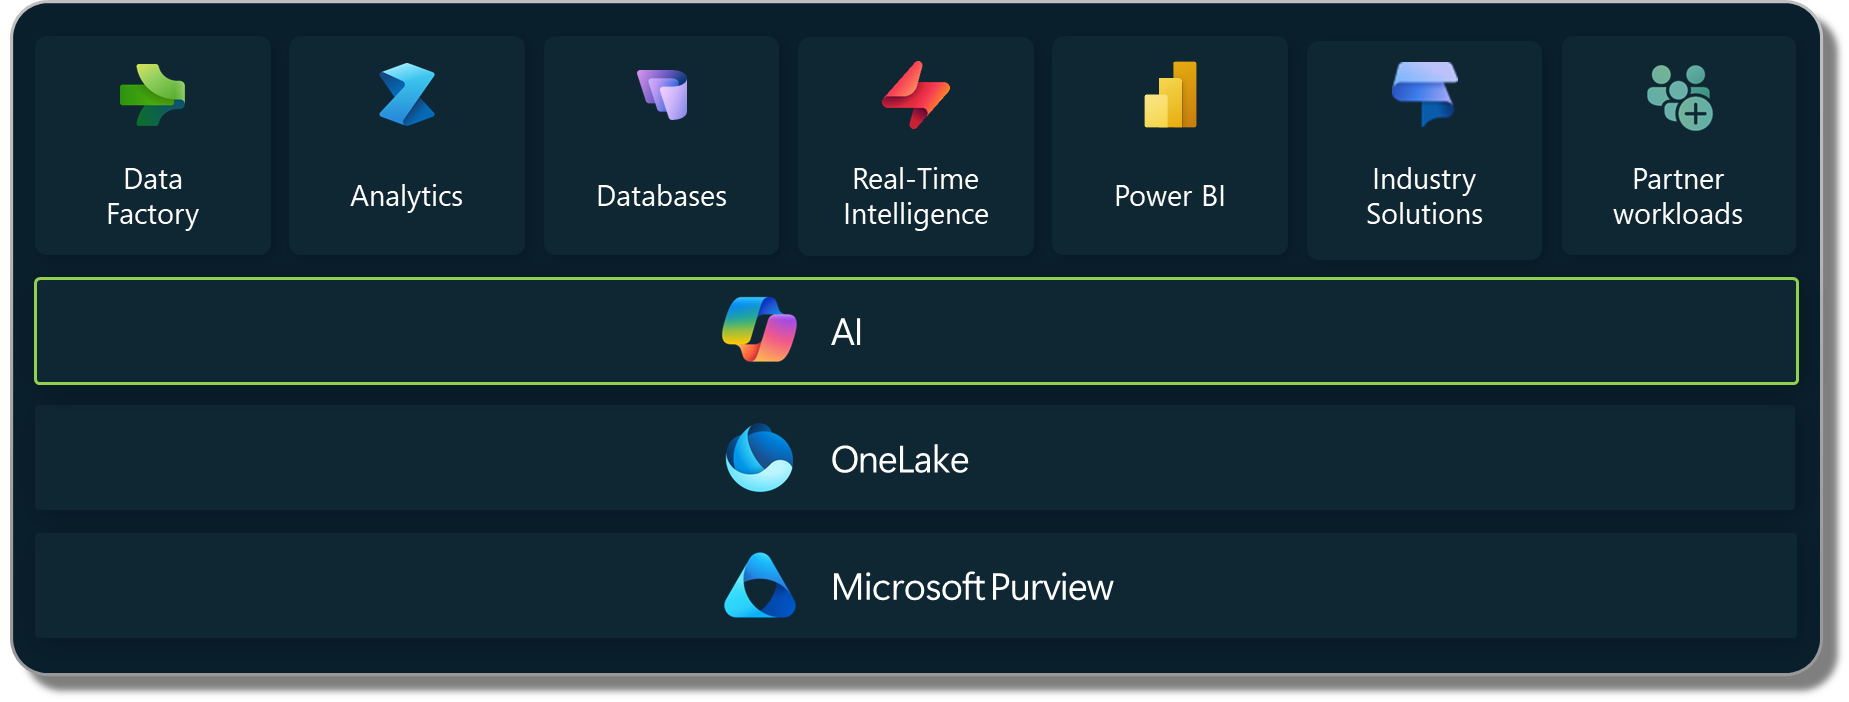
The requirement to chat with your data is a wish that comes up more often. Being able to ask any question to your data in natural language is not really new. We’ve had several experiences in the past in Power BI but also in other parts of the platform when we incorporate the broader scope of Microsoft Fabric. AI (artificial intelligence) is often a topic that comes up next and is at the core of what Microsoft Fabric as a platform delivers.
Let’s explore what options are on the table with Microsoft Fabric. In this blog I will explore three different options for natural language querying.
- Q&A in Power BI
- Copilot
- AI Skills
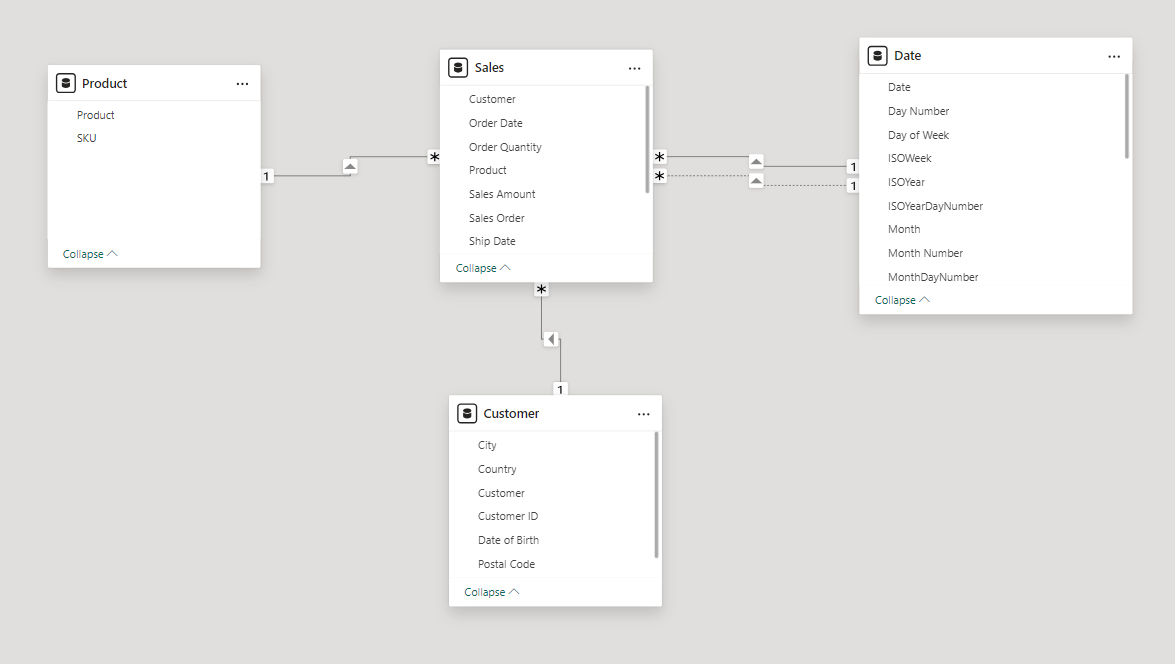
All examples I’ve used are based on a simplified set of data, existing of four tables being Date, Customer, Product and Sales. The fact table (Sales) contains a whopping 10 rows. An easy model, intentionally nothing complex. Depending on the solution, I’ve brought this data to a semantic model and enriched with three measures to count the number of orders, number of orders shipped and Sales.
Q&A in Power BI
For years already, Power BI includes a way to interact with your data based on natural language. The Q&A visual is something you can add to your report or dashboard to interact with your data in natural language. A few years ago, the potential of this solutions has blown many minds. However, to be honest, I have never seen any implementation of the Q&A feature making it beyond the proof-of-concept state.
The Q&A visual lets you talk to your data in natural language. It easily responds to your questions by mapping the key words to semantic model object names (tables, columns, measures). In this way, it easily matches terminology that has been used in the model and uses the business definitions of KPIs that have been built by analysts in measures for example. In case you may have various names for a certain KPI, you can easily add synonyms to the semantic model objects to let it response to other wording. The results of the Q&A visual will be presented in a Power BI visual and can be adapted to custom requirements by enhancing the prompt.
Asking it a first simple question “How much sales did I make per year?” we notice that the word “sales” is blue underlined. This tells us that the Q&A engine recognizes this word based on the model meta data. The word “year” is dotted-underlined. This tells us that is does have a fair idea what we may be looking for but does a good guess.

Though, I’m not fully happy with the outcome. First of all, it does not follow visualization best practices to start the y-axis at zero. Is suddenly starts counting at 3. Also, having a closer look at the data actually presented, it shows me a count of records in the sales table and is showing the $ sales measure as I created it. Of course, I can enrich the Q&A behavior by adding synonyms to my semantic model. Though, just adding “sales” as a synonym to my model does not do the job and leave the result unchanged.
If I explicitly ask for “Total $ sales by year” it will return me the result I was looking for. But honestly, nobody in the right mind will ask this explicit question as typical business users will not know the exact names of the measures, let alone follow the technical naming conventions setup by semantic model developers.
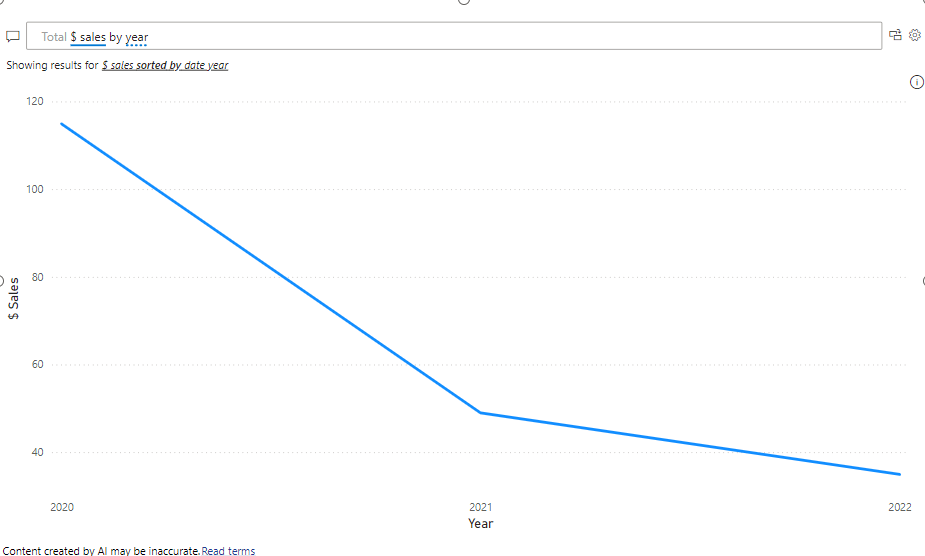
Year is still having a dotter-underline which tells us it is not sure what a year actually is. It shows us the suggestion to show the “$ Sales sorted by date year” in which is tells us which table to pick year from. As there are no other year columns in the semantic model, the assumption it did is a safe one. But imagine having other columns with the same names in your semantic model, requires the semantic model developer to think about potential Q&A usage of the model. Disable tables and columns that you do not wish to be used by Q&A. Also, specific business terminology can be enhanced using the linguistic schema. This brings a lot of additional complexity to the table and requires additional investments. The question that remains, does your customer prioritize you putting additional effort in the linguistic schema and is willing to pay for that?
Q&A in Power BI may not have been perfect in the past years, and it still is not. But I have to honestly admit that it has improved since the Microsoft’s investments in AI to enhance model meta data. However, I would still not implement the feature beyond a proof-of-concept state for customer projects.
Pros
- Ease of integration with existing reports and dashboards
- Data scoped to semantic model respecting measure definitions
- Data is presented in a visually attractive way
- Report creator can add suggested questions to inspire the user interacting with the Q&A visual
- Available for all licenses (Free, Pro, Premium-per-User, Premium capacity, Fabric capacity)
- Enhanced editor to exclude certain columns or tables from being included in the responses
- Synonyms can be added to increase response quality (automatic synonym population using copilot possible)
Cons
- Object names of the semantic model become more important than ever before to match business terminology
- May return unexpected results based on tables and columns having similar names
- Interface still resides within the report or dashboard and cannot easily be brought to alternative locations (with some exceptions for Power BI Embedded)
- Cannot be enriched with external sources or documents stored outside the semantic model
- Support for different languages is challenging, works fine in English but Dutch (my own native language) does not work so well
Copilot
Copilot is all around you, integrated in (almost?) every Microsoft service nowadays. You may be wondering, why don’t we just use copilot to ask questions to our data? I’m not going to hide it, personally I’m opinionated about the whole copilot experience and not really a fan of it. In some cases, it works fine and helps to ease work, but in all cases, you still have to validate and check the outcomes of copilot. Maybe it is due to the expectations of copilot? As some might approach it as autopilot.
If the only tool you have is a hammer, it is very tempting to treat everything as if it were a nail. Should we answer all our questions based on copilot? I highly doubt so. Though, copilot deserves a fair chance! My personal experiences with copilot and asking questions about my data are based on different fronts across Microsoft Fabric. In this section, I will talk solely from the experiences in Power BI to answer questions based on my data, leaving all features to enhance the development experience out of scope.
There are many places in Power BI where you will find copilot. You will find it in both Power BI desktop as well as in the Power BI service (Fabric service if you will). For below examples, I used the copilot pane in Power BI desktop asking for “sales by year” based on the same semantic model as I used for the Q&A visual. The copilot experience can be opened from the top ribbon in Power BI desktop. All results have been tested in the Power BI service too and returned the same or very similar outputs. Other copilot experiences like the DAX Query View are not considered in below examples as they are more intended for solution creation than data consumption. Find all copilot integration for Power BI in this documentation.
At first tests, the results returned by copilot did not give us the desired outcome as it interpret the year as a number. In our semantic model, the year is stored as a whole number in the date dimension. As for Power BI this is just a number, the auto summarization feature kicks in and it took a sum of years. Obviously, this did not make any sense. This directly shows the importance of setting the correct data types in your semantic model. Changing the default summarization to “none” gave us the desired result.
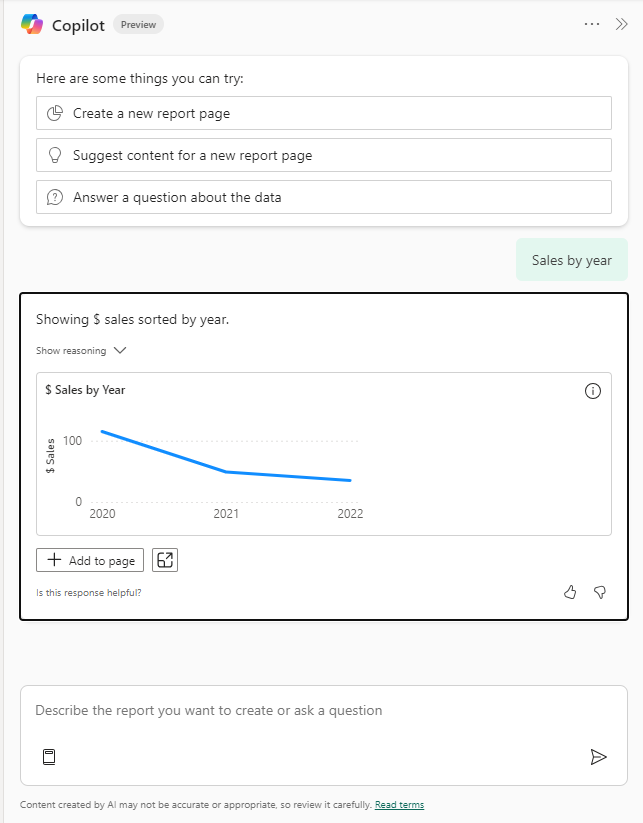
We can easily add this chart to our report page, which is mainly helpful for the report author. Also, we got the result we expected. Let’s enhance our questioning a bit. I’ve asked copilot what it can conclude from the orders placed versus the orders shipped. The result is no longer a visual but is a text summary instead.

The results are not necessarily wrong but are lacking context awareness. Especially point two, in which copilot tells us that our data quality is not in order. There are weeks in which no new orders were placed, but there were orders shipped. Let’s validate with some actual data. When we look at the table, we get the following result:
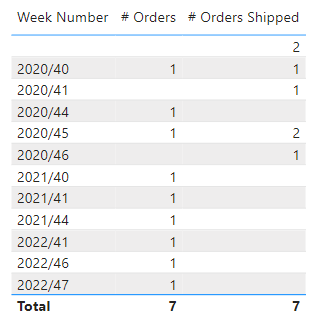
This conclusion of copilot is a bit odd. Imagine you have a retail business in which orders placed are shipped the next day. In that case, you could have orders on Sunday which are only shipped on Monday. This is not really a data quality issue, but more a misunderstanding of context.
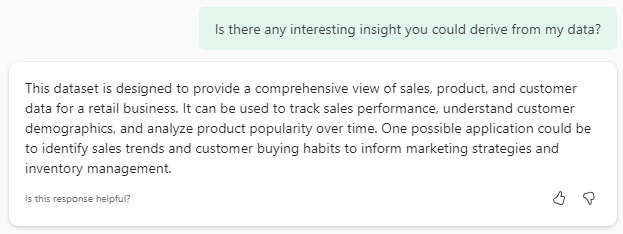
When we ask copilot to come up with any further insights in my data, it returns a basic description of what the semantic model contains, and a typical AI generated response.
Honestly, I’m not too happy with the results produced by copilot as I showed them above, I also experienced cases in which the outputs were fairly okay. Simple questions like “Sales by year” or “Which month has the most sales” are relatively straight forward and copilot answers them as expected.
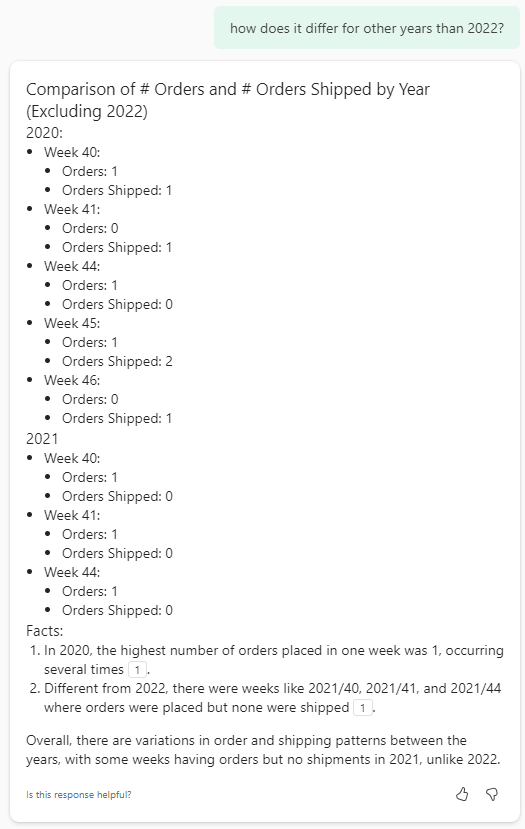
While increasing complexity, copilot provides a conversational experience to improve response rate and accuracy of the answer – which is a good thing! When I asked, “What is the product we sold the most, and how does it differ over years?” copilot did not really understand what I was looking for and asked to enhance my question. By doing so, it provided me the answer but forgot about the context of years I asked about before.

When I kindly reminded copilot (again) about the year context, it got totally lost and ignored the question about most sold product. The response is more less a printout of the table showing the orders placed and shipped over time.
I think we can conclude that copilot does not yet fully do what we expect. Nevertheless, let’s look at some pros and cons.
Pros
- Ease of usage and availability across Power BI Desktop, Service and Mobile
- Conversational experience which allows follow-up questions for example
- Prompts are enhanced with generic AI knowledge which increases ability to understand and process the questions
- Capable of delivering both visual as well as textual outputs
- Textual outputs (as in summaries) can sometimes be easy for management
Cons
- In a conversational experience, copilot may lose track over the original question
- Copilot may return incorrect results which could lead to wrong conclusions
- AI models may be hallucinating and making up answers not based on actual data
- Using copilot in Power BI (or elsewhere in Fabric) requires P1 / F64 licensing
- Your tenant administrator needs to enable copilot first, it is not available by default
- It has a significant impact on capacity utilization, which may make your capacity administrator hesitant to enable copilot
AI Skills
The final option in scope of this blog, is AI Skills. AI Skills are part of the data science workload in Microsoft Fabric and released in August 2024 in public preview. It delivers custom generative AI experiences for your data. It generates T-SQL queries based on large language models (LLM) combined with meta data of your model. It is key to know that no data but only the meta data consisting of table names, column names and data types is sent to the LLM. AI Skills have some key differences with the copilot experience we looked at before. Where copilot does not allow for any tweaking or training, AI Skills allow the author to enhance the model with additional context and let it answer and behave the way you want to.
The chat interface of AI Skills is developed within Microsoft Fabric but can be leveraged in different places. The AI Skill can be published to get a seamless experience without too much cluttering around it, as well as integrated in other places to bring the chat experience to where the user is like Microsoft Teams.
Currently, the set of sources you can connect to an AI Skill is limited to Fabric lakehouses and warehouses. During Microsoft Ignite (November 2024) it was announced that the set of connectors will increase to also incorporate Eventhouse KQL databases for streaming data purposes, as well as Power BI semantic models in the future.
The approach to use AI skills is slightly different than what we’ve seen before with the Q&A visual and Copilot. An AI Skill is an item in a Fabric workspace which you need to create separately. The data you want to use, must be available in a Fabric lakehouse or warehouse. Alternative storage does not work at this point and the data must reside (or linked to) Fabric. Data connected over shortcuts should be fine, but in case you have a SQL database somewhere, you first need to bring the data to Fabric to make it work. I think the creation of an AI Skill is relatively self-explaining. In case you’re looking for some guidance, I recommend this documentation.
After I’ve connected my lakehouse and selected the tables, let’s get started! I did not yet enrich the AI Skill with any specific information yet in the notes for model section. The first question is the same as in previous cases “Show me the sales by year”. Before the result is shown takes a while though. In my experience the first question is always slower as it needs to start-up the compute on the back end. The AI Skill provides a simple answer in table format, so no fancy visualizations or whatsoever. If enabled (optional) it also shows the SQL query that was executed to generate this result.
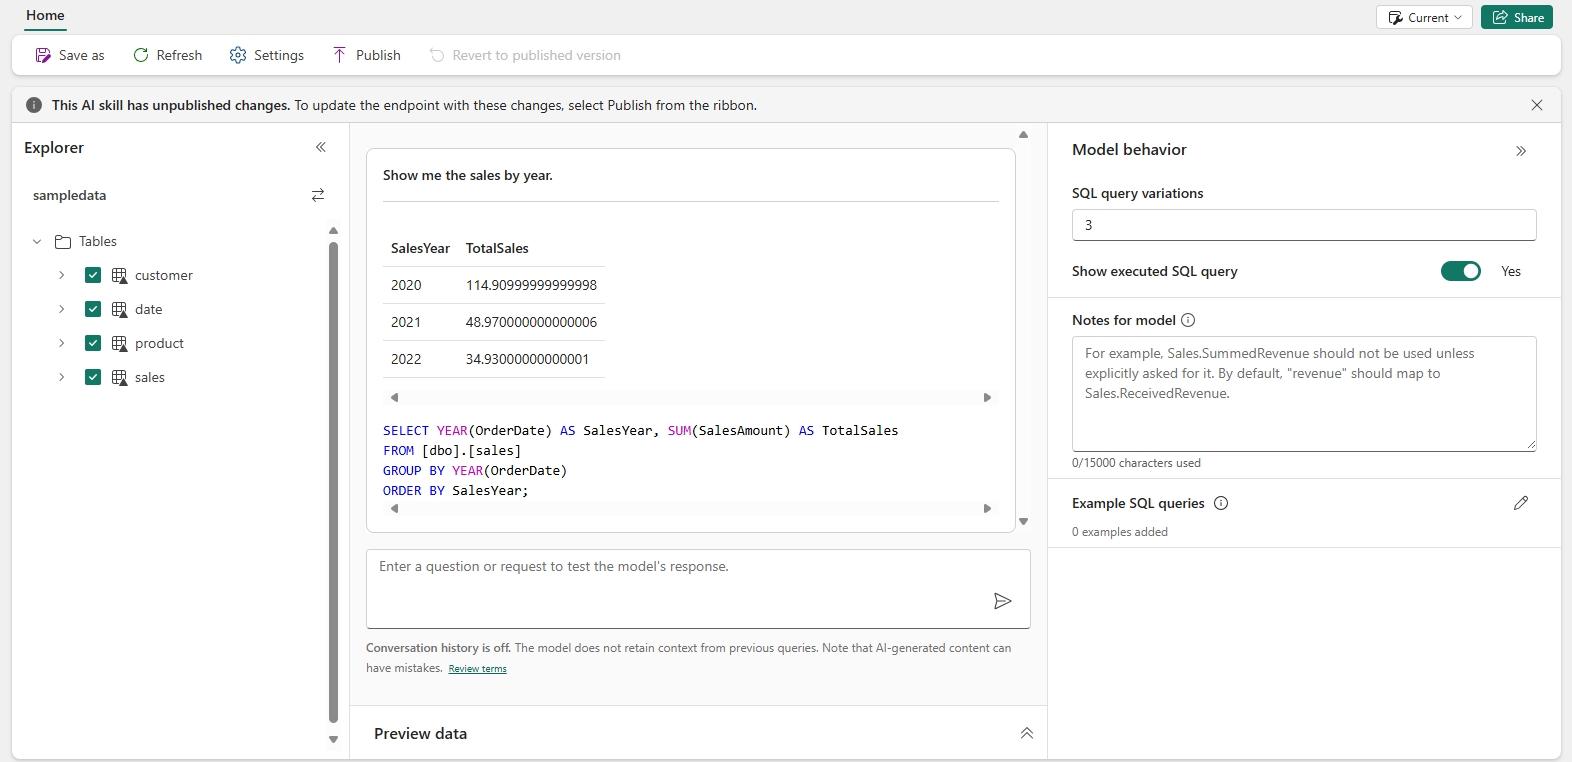
Based on the previous examples, we can conclude the result is correct. Also, the SQL query helps us validate the outcome. What is interesting to see, is that it did not use the Year column from the Date table, but used SQL instead to get the year from the OrderDate. More on that later.
SELECT YEAR(OrderDate) AS SalesYear, SUM(SalesAmount) AS TotalSales
FROM [dbo].[sales]
GROUP BY YEAR(OrderDate)
ORDER BY SalesYear;
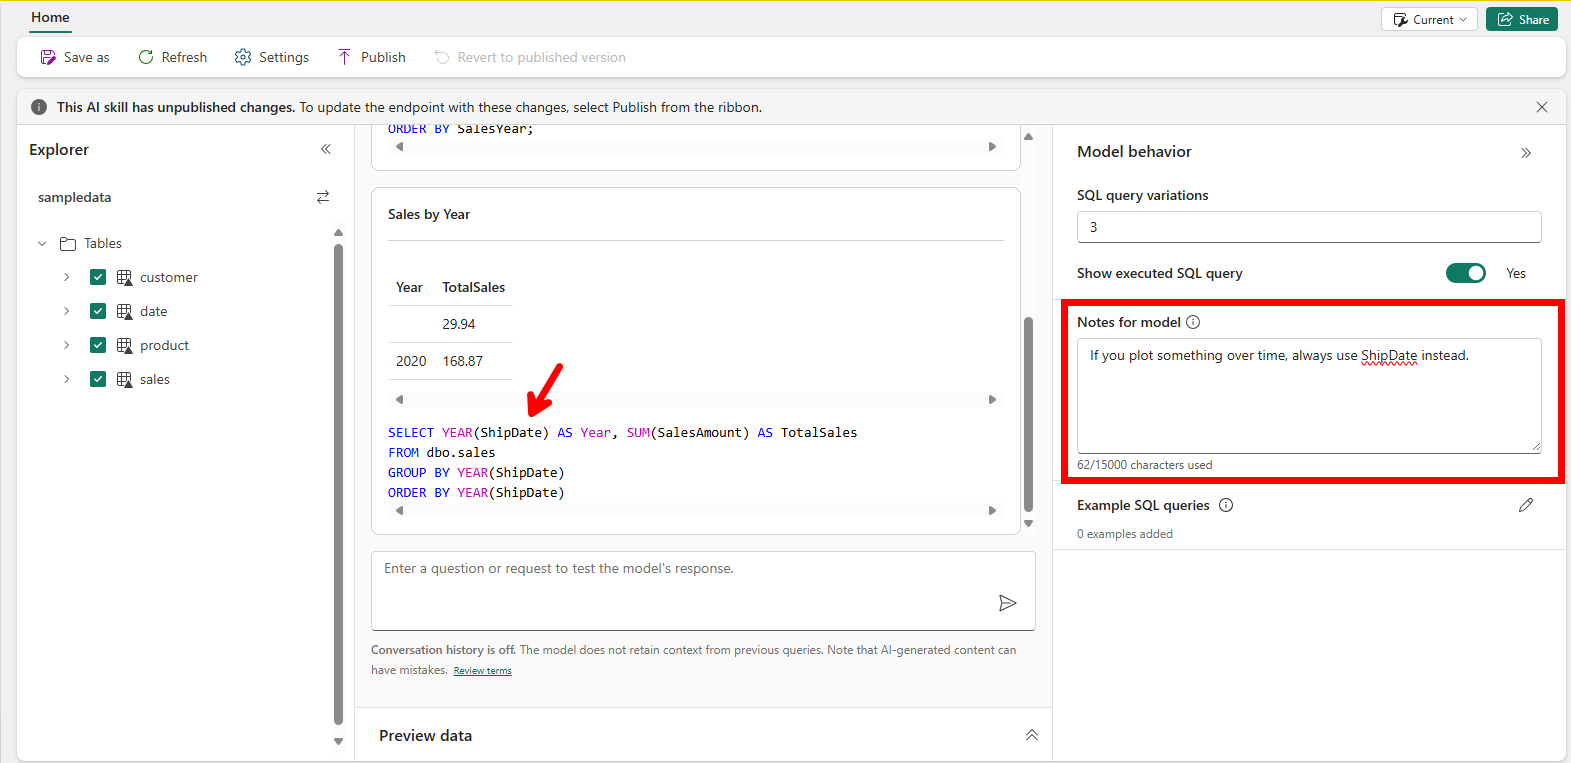
Without me telling it, it used the OrderDate, although there are multiple date columns in the Sales Table. Imagine that I always want it to use the ShipDate for example, this is the logic I can add to the Notes for Model section. I added a line of text to the Notes for Model to tell the engine to always use ShipDate instead. By asking it again the same question, it now returns the Sales based on the Year in which the order is shipped.
In this case, the result is limited useful due to the small dataset. Another thing which is interesting, is the formatting of the Total Sales. The first result showed us many decimal places, where the current question only returns 2 decimal places. As we look at a holistic overview of years, I rather round by zero decimal places. Also, given we talk about money, I rather have this formatted as money. By simply enhancing the Notes for Model even further, I can let it respond the way I want to.
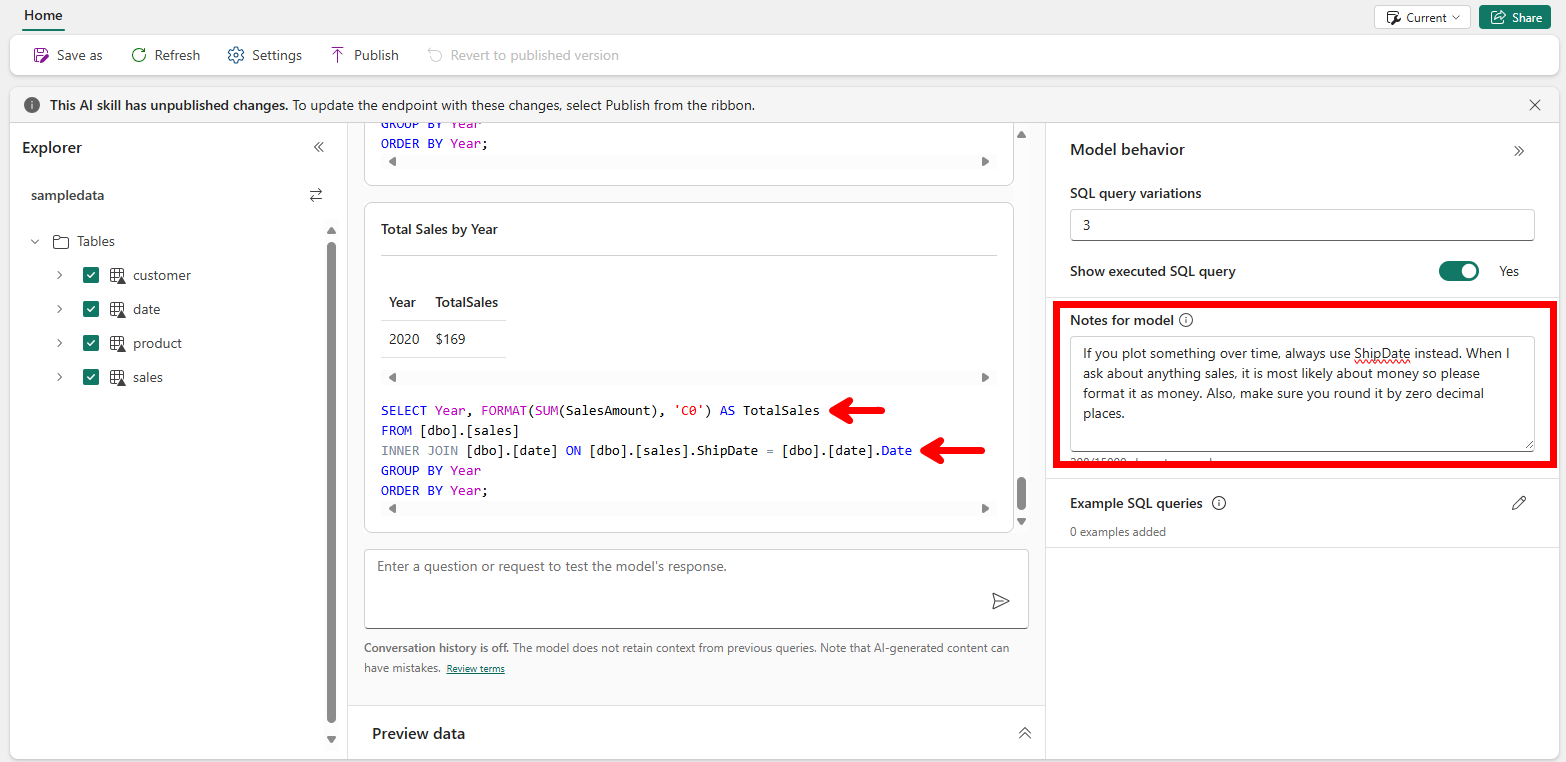
An interesting change that has been made in the latest example too, is the fact that is suddenly started using the Date table to fetch the year. This is solely due to using exact string matching on the back end. The words in the question are matched with the table and column names from the source lakehouse. Given I first typed “year” all lowercase, it did not find a match. When I use “Year” with uppercase, it matches the column name in my Date table and performs an inner join. Both results below:

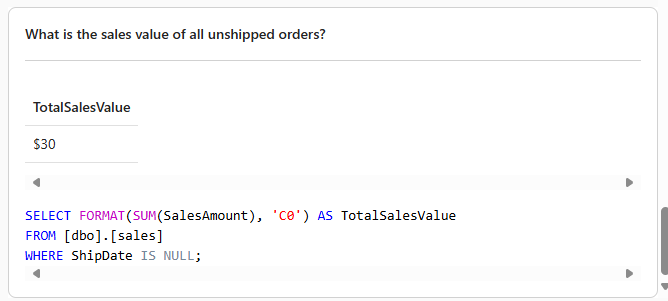
In training the AI Skill, this behavior important to know, given the inner join results in a potential incomplete view of the total sales. This incomplete view is due to the fact we use the Ship Date to plot our data over time. Any order that has not been shipped yet, the ShipDate column is empty. Due to performing the inner join, the sales for all unshipped orders are not shown. Of course, it is important to also understand the sales value of all orders that were not shipped yet. A simple question like “What is the sales value of all unshipped orders?” is perfectly understood by the Large Language Model behind the AI Skill to return us an accurate answer.
Finally, to give it the same more complex question as we also asked to copilot.
“What can you conclude from the orders placed versus the orders shipped?” The answer to the question doesn’t make any sense though, as it took the sum of the OrderQuantity, which only tells us something about the number of items in the same order, not about the order count. To make sure in the question is properly answered in complex scenarios, there is an option to provide sample SQL Queries, next to the notes for model. This will allow you to write your own SQL which it will use with the LLM to answer any future questions.

Once done developing your AI Skill, it is time to publish the AI Skill and share! This will remove all the clutter from the interface and makes it a neath chat interface for users. Also, AI Skills can be published and later on used as source for Copilot Studio. Especially the integration with Copilot Studio can be very interesting to bring the chat experience to the users in Microsoft Teams and connect even more data sources to the chat – like documents that live in SharePoint.
Pros
- Ability to include more sources than only semantic models
- AI Skills provide a lot of room for customization
- Training the model in normal text and telling it what you expect the model to do
- Integration with Copilot Studio allows combining different kind of sources like documents
- Natural Language to SQL (NL2SQL) is likely more successful in a Large Language Model than interfacing with other languages like DAX
Cons
- Results are provided in table format, no visuals or other visually appealing way to display the results
- AI Skills are currently in public preview; many things may be adapted to change
- AI Skills requires a P1/F64 capacity
- Unclarity on capacity utilization, as AI Skills are currently in preview
- It is not really a conversational experience as follow-up questions do not take into account any previously asked questions or results
- A lot of time can get lost in tweaking the model
- Due to exact string matching and lakehouses not supporting user friendly column names (spaces and special characters), the AI Skill may require more tweaking than initially needed
Take aways!
From all the experiences discussed in this blog, I can no other than conclude that there is a huge potential, but none of the options fulfills the need out-of-the-box. All require some customization. But one conclusion that is very clear, is that data quality and data modeling is more important than ever before! For the simple reason of exact string matching and the way how meta data from your solutions is used in large language models.
Also, the dataset used for tests in these technologies was very limited and small. My take-away is that increasing the number of tables and columns in the solutions will increase the chance of getting incorrect answers. Therefore, I would recommend building multiple, but smaller and tailored chat interfaces, rather than one that potentially can-do-it-all.
If I had to build a solution to chat with my data today, I most likely would choose for the AI Skills. This is grounded by several important points for me as listed below.
- Potential to bring the chat interface to the user by integration with Copilot Studio.
- Options for tweaking and customizing with the notes for model section.
- Higher chance of success with NL2SQL
But in the end, it all comes down to making a business case whether having an option to chat to your data justifies the investment of a P1/F64 capacity and the investment needed to make the model work well on your data. I personally hope AI Skills will become available on smaller Fabric SKUs one day, which makes the business case already more interesting.

Pingback: Introduction to OpenAI and LLMs – Part 3 | James Serra's Blog
Pingback: Natural Language Interaction Isn’t Magic—It’s Semantic Modeling Done Right – Data – Marc