
Imagine you have a semantic model in the Power BI Service (or Fabric if you will), and you’re about to make a breaking change to this semantic model. How do you inform your end users? How do you tell them about this change? In this blog I will zoom in to options you have in the interface that will help you to reach out to your users, looking at different aspects from other reports in Power BI, but also more complex the users that connect via Analyze in Excel.
Case
As a BI department in an organization, you have a semantic model which is centrally managed. Together with this semantic model, you share a standardized Power BI report. Also, you allow users to setup self-service solutions. Basically, you granted them build permissions which let them build their own Power BI reports on top, next to the extensive use of Analyze in Excel.
However, due to reasons, your semantic model has to go through a big change. The structure of your semantic model will change, as well as measure names, column names etcetera. As a result, many self-service solutions are about to break. Now, to make all users aware, you want to inform them about this upcoming breaking change. But how?
Impact analysis
Power BI offers an out of the box solution to inform all users who own any solution that connects to the semantic model. This feature is well hidden in the lineage view within the workspace and is called “Impact analysis“. Once you open the lineage view, you can click on the button “show impact across workspaces” on the semantic model item. This will show you any other reports and/or dashboards connected to same semantic model that you have access to. Also, it will tell you if there are any more items connected in other workspaces outside your permission – like somebody’s personal workspace.
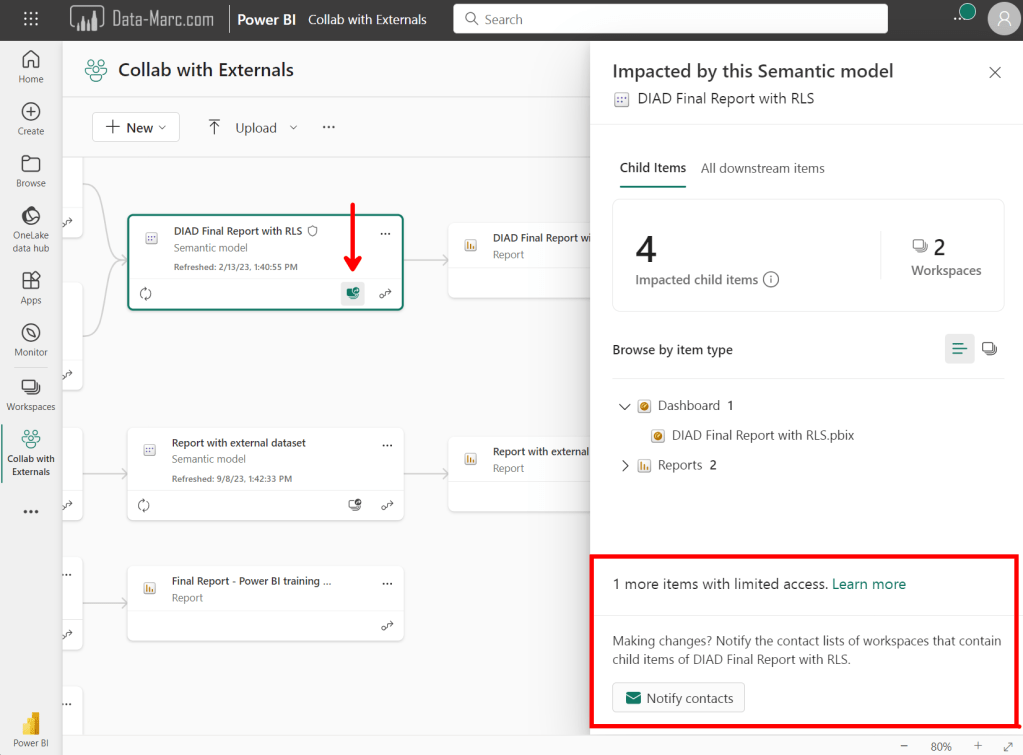
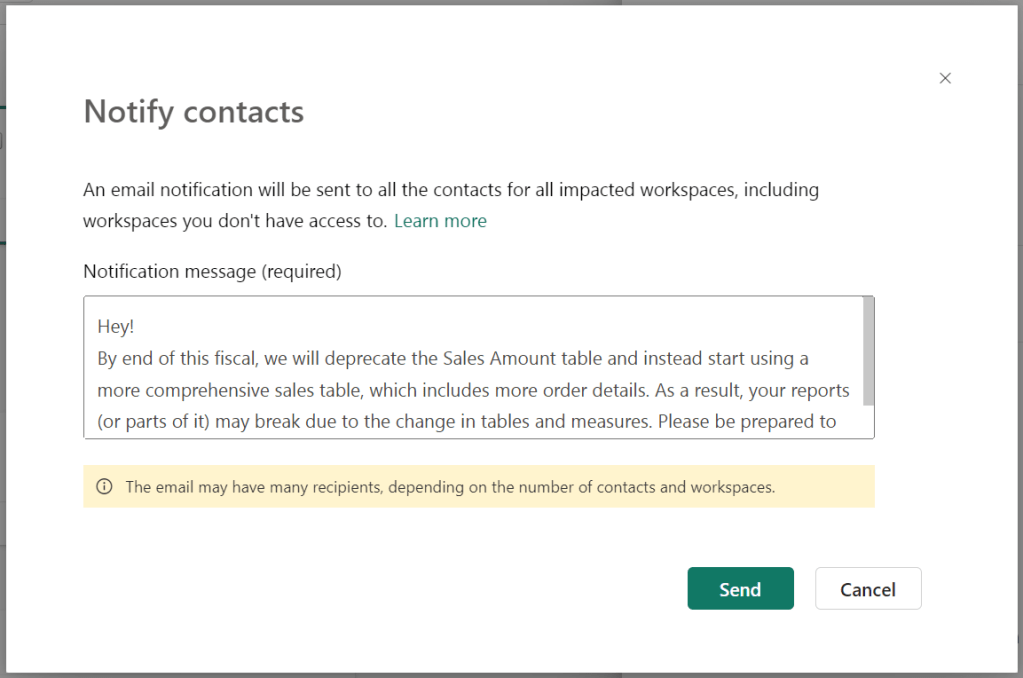
On the bottom, you have an option to notify contacts which helps you to inform users about the upcoming change. This will open a dialog box where you can prep your message you want to send, although you may not be fully aware who you are sending it to (given the items you don’t have access to). These folks will see your message paired with your name, so in case of questions they can reach out to you.
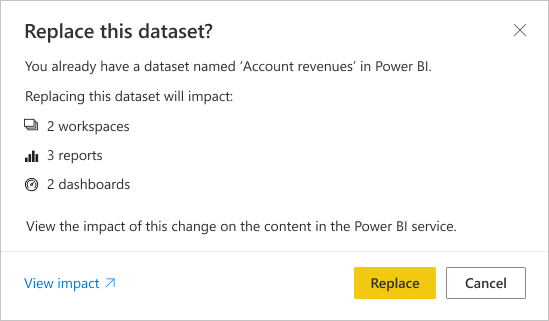
So far, a fantastic feature! Super useful, though very well hidden! Also, from the publish dialog in Power BI Desktop, there is an option directly navigate to the impact analysis in case you overwrite an existing semantic model in the Power BI Service. Though, knowing myself – I barely look at the publish dialog and often just click “replace” instead of analyzing the actual impact.
The scope of the feature so far has been limited to only Power BI items, like other reports and dashboards. But what about all those users that are using Analyze in Excel and have their Excel file saved locally. How do you reach them?
Scope extended to applications outside Power BI
Excel is just an example of another tool that could connect to your semantic model. Maybe, your semantic model is also used to fetch data from and use elsewhere by leveraging APIs, or maybe others are connecting with another reporting application like Tableau or Qlik to your Power BI semantic model. How do you inform them about the upcoming changes?
There is no easy way of doing this, as Power BI is not aware of any external connections. Therefore, the “notify contacts” option will not reach them. What alternatives could you use to figure out who is connecting to your semantic model?
Audit logs
If you have it enabled (most organizations do) you could check the Power BI audit logs which contain all information about user actions in and related to Power BI. For example, you will find the activity “Analyzed by external application” which identifies any connection setup by another application not being Power BI, connecting to the semantic model. This includes connections like Excel, but also any other tools that can connect.
The problem is though that the audit log contains much more information than you actually need. All user activities for all users in the tenant are tracked in there. Also, the audit logs are only available to Fabric / Power BI Service Administrators.
Also, an Excel file that may have been used in the past or on monthly bases for example, may not be showing up directly. Therefore, you need to monitor the audit logs for a longer period to figure out which connections are utilized by users. Collecting over a longer period, means you need to get the data out and store it somewhere. The detail of the data, combined with the scope which is broader than only one workspace or one solution, this will bring up GDPR topics. Audit logs, as the name already implies, are intended for auditing purposes and admins, not for these kinds of options.
Even if you are an administrator, you may be interested to find out who is connecting from Excel and if this is not breaking any setup authorization or compliance. Collecting the audit logs is the way to go to collect this type of information across many workspaces. Automation of collecting this information is advisable, through the example with PowerShell that Microsoft shared, or any other way like through APIs. You can find some examples in this documentation.
Log Analytics Integration
Probably your best option is to connect your Power BI workspace to Azure Log Analytics. This connection allows you to store all query telemetry from all that happens to semantic models in your workspace. All this telemetry will be saved in Log Analytics in which you can start analyzing by using Kusto Query language, or alternatively you connect it to Power BI again and us Power BI to do your analysis.

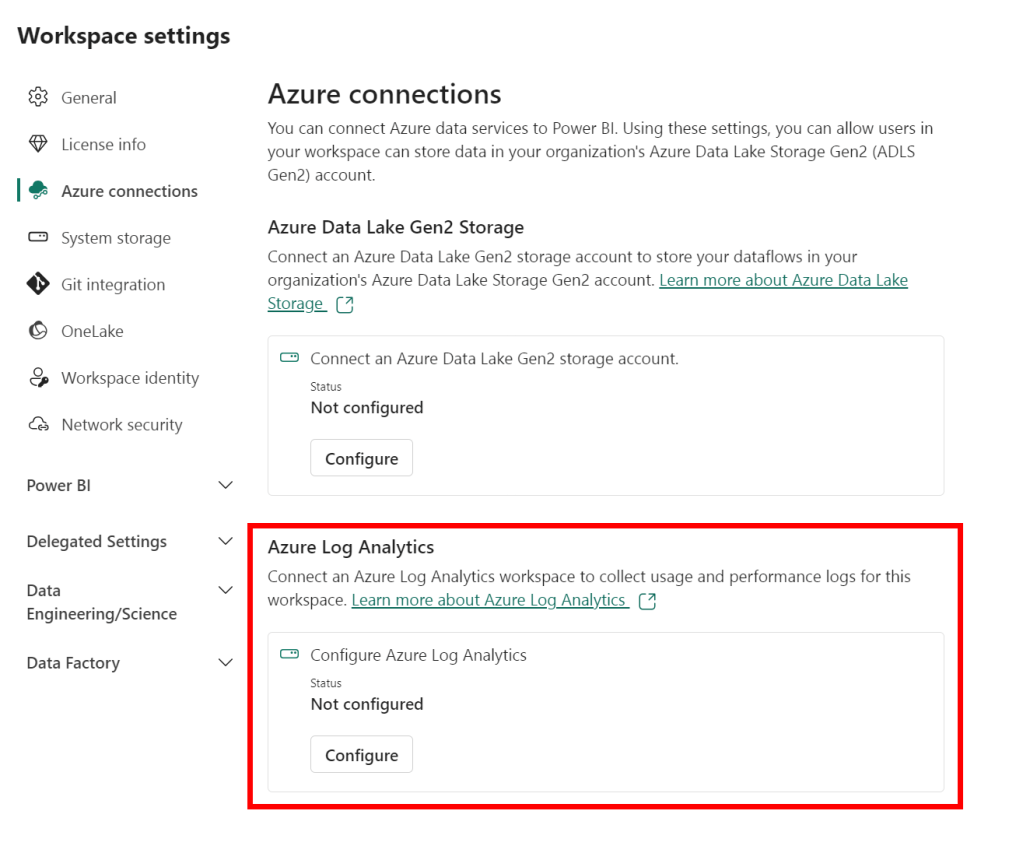
As workspace administrator of any workspace that runs on Premium (or Fabric), you can configure Azure connections in the workspace settings. Right there, you can link your workspace to Azure Log Analytics. Be aware that you need to configure this for every workspace separately.
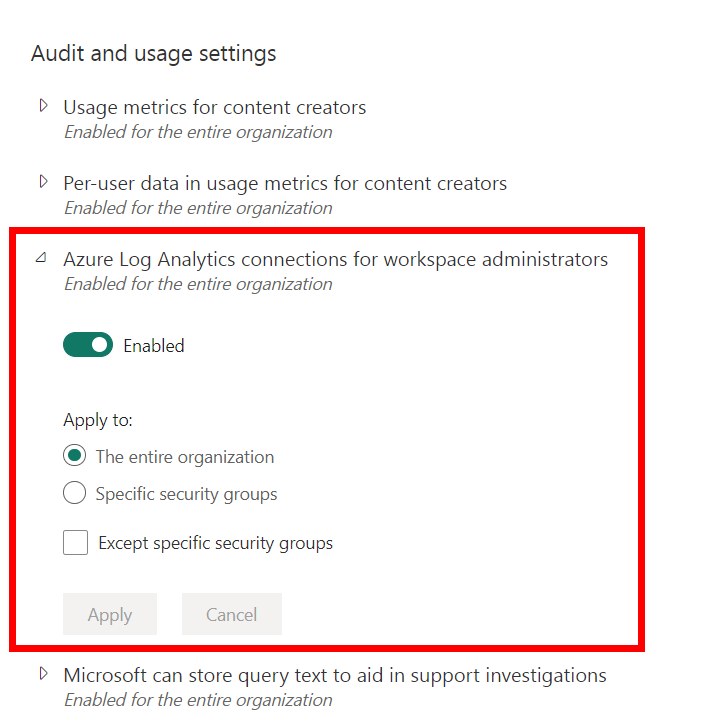
In case this setting does not show up for you, your tenant administrator may have disabled this feature. Under the section Audit and usage settings, they can enable this integration for all users or scoped to a security group.
Also, Log Analytics has to be created in an Azure Subscription which will result in additional cost. These costs are not covered by your Power BI license – also not if you run on a Premium or Fabric capacity. The more telemetry you collect, the more it will cost. Therefore, consider if you really need this to be enabled all the time, or just for a shorter period of time to do your extended impact analysis.
The Log Analytics integration includes very detailed level engine telemetry about all queries received by the engine. Like every visual on the screen of a report will result in one or multiple queries. Each of them, including timings, will be visible in the logs. Also, the interacting application is visible. Analyze in Excel, Power BI reports, composite models are all covered, it is even visible when users export data to Excel.
Based on these logs, you know exactly who is doing what with (or to) your semantic model. In terms of hitting it hard by suboptimal queries, but also connection wise. Based on this, you can reach out to all these users to inform them about the breaking change.
To control the cost and limit the level of detail you save over a long period of time, you can make use of the retention settings of Log Analytics to automatically delete all logs older than X days. Another quick tip to start analyzing the log results in Power BI, is to leverage the build-in M-query generator that helps you to setup the connection from Log Analytics to Power BI desktop. The step-by-step guide can be found here.
Wrap up
It is clear that the build in impact analysis is a good start but provides an incomplete view of all connections to the semantic model. In case you disabled any external connections like exporting data, or Analyze in Excel, it might be sufficient for your purpose. However, keep in mind that also some connections within Power BI (like composite models) are not captured and will be hit by the impactful change. For the full picture, your best way forward is setting up Azure Log Analytics integration to capture maximum detail about your semantic models only.
As this blog is focusing on what you need to collect logs for all applications connecting to your semantic model, it primarily focused on the concept of Log Analytics. However, it gives an incomplete view of all capabilities the integration has to offer and the various setups with Log Analytics that can be considered. As I don’t want to copy-cat the official documentation about this integration, I recommend checking out the official documentation before implementing.

Pingback: Building an Impact Analysis Process – Curated SQL
Pingback: The importance of monitoring – Better to allow in a controlled manner than to prohibit in an uncontrolled manner – Data – Marc