
It has been roughly two years since the last update on the Power BI Model Documenter, an external tool that I developed to auto-document Power BI Semantic Models. Back then, we still called it datasets though. Looking at the stats of my website, the model documenter and related posts/pages are still most read on my website – every month again.
As the technology has kept on improving, there are new options that will help you to kick-start generating documentation about your semantic model. In this post, I will elaborate on how you can use AI in Power BI to enrich your Model Documenter output, by helping you describing the measures you’ve added to your semantic model.

Where did we come from?
It all started when I was done manually writing documentation for my DAX measures during projects. Back in 2020, I build the very first version of Power BI Model Documenter when external tools for Power BI first launched. Over the following two years, I wrote multiple related blogs, pushed updates and enhanced the tool stability and functionality. In case you want to see all details on Model Documenter, I recommend checking the dedicated page here.
A related blog I wrote and still gets many views, is the initial blog where I stated you have to document every item you add to the semantic model (dataset), being each calculated column, measure, calculation group, row- and/or object-level-security role. It takes a lot of effort to describe all these items, especially if you want to describe a model you started working on a long time ago.
Now, two years have passed. We’re living in the Era of AI and we use copilot, ChatGPT and other models for our daily work a lot. Let’s have a closer look on how you can use these AI tools to describe your Power BI semantic model.
Using AI to describe your semantic model
One of the first blogs I noticed after ChatGPT became available to the masses was early 2023, when Darren Gosbell blogged about automatically generating measure descriptions based on the ChatGPT API and Tabular Editor scripting.
I personally tried it out directly and was enthusiastic at first. However, since the output generated also changes every run, there is a likely risk of issues here. Also, you want your descriptions to be consistent and not change every time. Next to that, the trustworthiness dropped quickly, as it turns out that ChatGPT is not very good (let’s just say very bad) in writing DAX. So, how could an engine that is not capable of writing a language, properly understand and describe your model? But okay, it’s a start…
Later on, in February 2024, Microsoft released the preview of Generating measure descriptions with copilot. A similar approach as Darren blogged about, but less hacky and code-heavy, given you can just click a button within the Model View of Power BI.
I blogged about my sceptic view on copilot before. However, I was pleasantly surprised by the output generated by copilot when generating descriptions for your model. Below an example of a simple measure and the generated description:
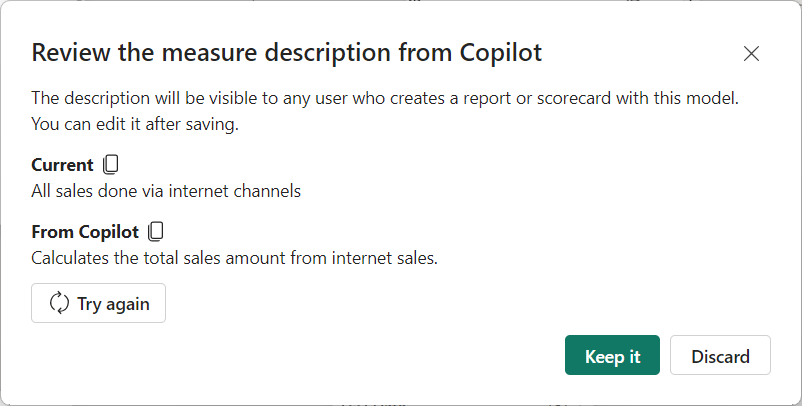
So far, so good. A very straight-forward DAX expression that gives an idea what the measure is about. Let’s try a more complex one now, which is a measure about new customers, taking roughly 22 lines of DAX and uses a variety of DAX functions.
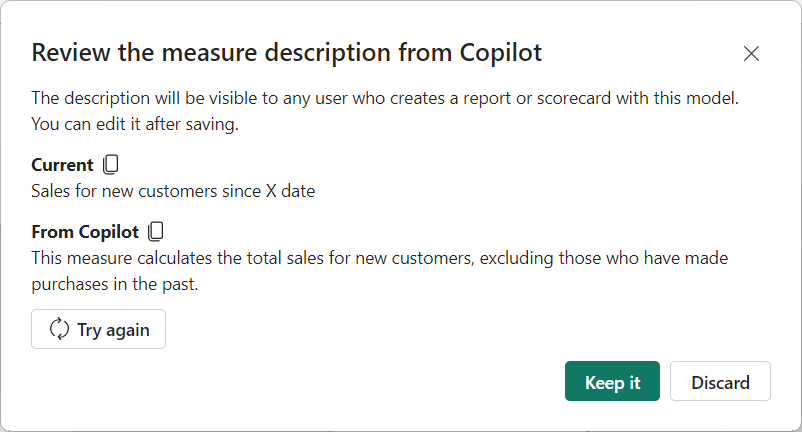
I was pleasantly surprised by the output again. I took it for a ride and translated some tables from English to Dutch. Reseller Sales became “Winkel verkopen” and I tried again with a simple measure that just takes the sum of Sales Amount. The description generated returned “calculates the total sales amount in the store”.
All by all, we’ve been using Adventure Works data up till now. Let’s switch to a semantic model with a totally different context and try again weather it understands the context. I’ll just take the Model Documenter Semantic Model and report here, as this Semantic Model includes non-typical things.
As sometimes people go crazy with what they do in DAX, I took an expression that returns a base64 image for either PQ or DAX Calculated Tables. So two lengthy text strings are in the expression. The returned value by copilot was the following:
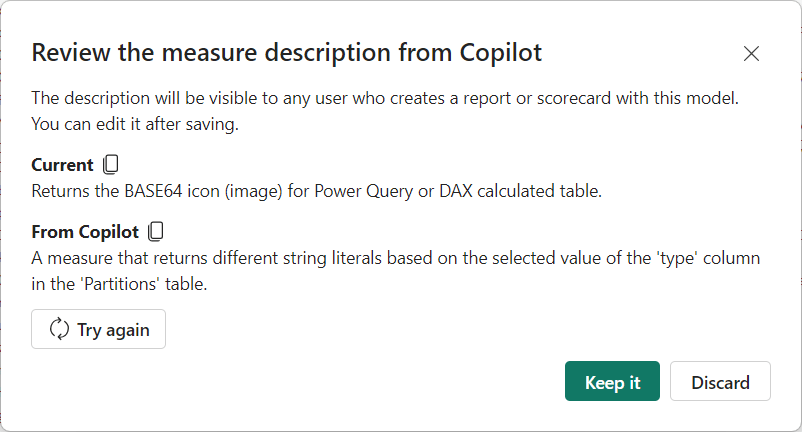
I have to say, it still describes what is happening in the measure. However, it is missing crucial context here, let’s call it the business context. Copilot is fine in describing what the expression is doing in technical terms, but in this example it was crucial to add the relation to what the type column is describing and what possible values there are in the type column (being PQ or DAX Calculated Column). Especially since a ‘type’ column can exist in roughly every dimension table in your model.
Let’s try one more, a measure that should return the partition expression when a user of Model Documenter clicks on a table or partition in the output report. For sure, not the most beautiful piece of DAX I ever produced, with a lot of nested logic and conditions to check.
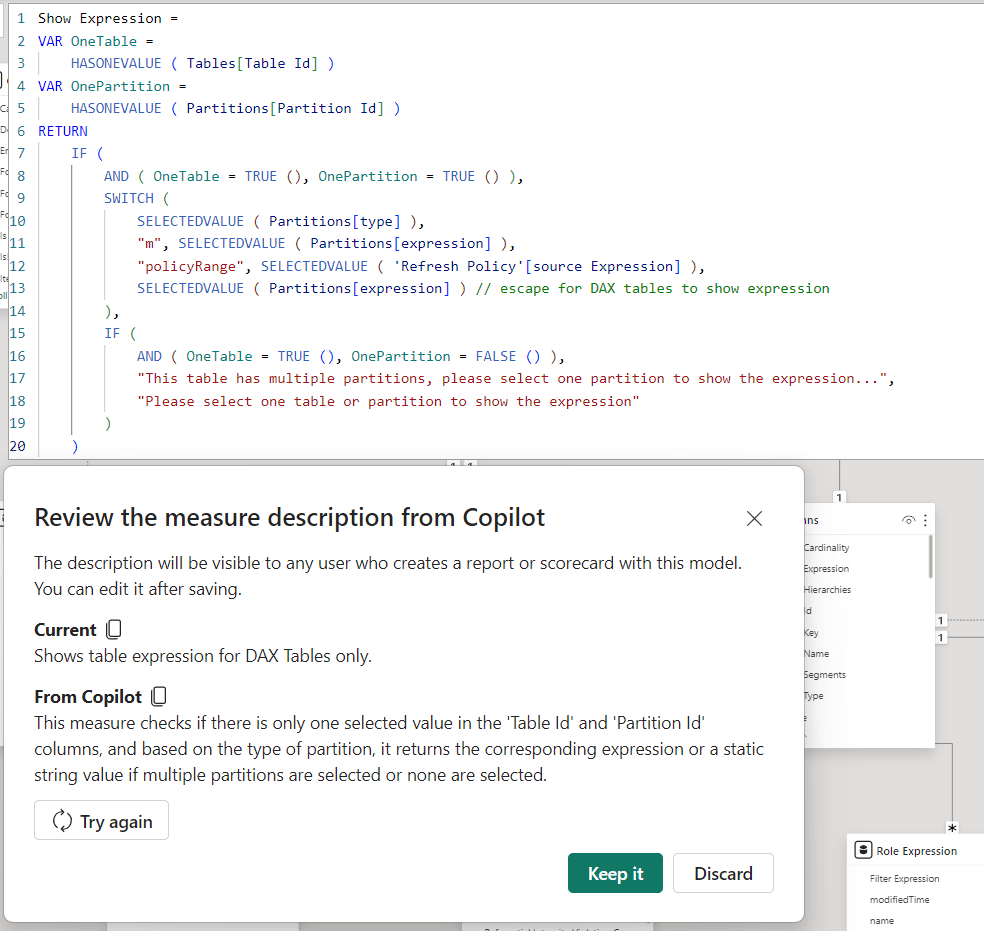
The output generated in this case is pretty decent! It even relates to the conditions that are checked, however again misses the purpose / business context of the description. And those are the people we use descriptions for, right?
Thoughts and conclusions
After playing around with copilot to generate descriptions for a while, I’m happily surprised. But… in the current state, it is only useful when you generate documentation for your co-worker / developer who wants to understand the expression without reading the DAX. If you use copilot to generate descriptions for business users, they will for sure be lost and maybe even more than before. I don’t expect a business user to know what a “string literal” is for example. Therefore, I would advise to still enrich every description with business context, why is this measure even existing? When should you use this one, versus one of the others? Etcetera.
Secondly and maybe even more important. In order to use copilot, it requires a Power BI Premium P1 or Fabric F64 capacity. That means, it comes at a price! Luckily, not every semantic model needs to reside in a workspace on a P1/F64 capacity to use this feature. It even does not have to be published at all. At first use, you have to select a workspace that runs on the required capacity size, after which you can run copilot for all other Semantic Models in Power BI Desktop. Honestly, I doubt if this is intended, as it feels like a glitch to me. In theory you could just setup a single capacity to document all your models in the organization. Though, keep in mind the effect on capacity utilization when leveraging copilot.
The usability of copilot to generate measure descriptions is still lacking a bit. Although developers don’t have to type all the descriptions manually anymore, they still have to go through all measures one-by-one to press the button and wait for the dialog. Preferably, a button to generate for all would be super useful. Still having a dialog to confirm is necessary if you ask me. Maybe even being able to alter the descriptions in the dialog would be fantastic. Just present all generated descriptions in a table, where you can easily adjust and save.
Last but not least, the functionality is limited to DAX measures at this moment. I always feel that every object in your semantic model should be described. That includes things like DAX Calculated Tables, Columns, Field Parameters, Power Query Parameters and overall, just columns and tables. But hopefully the scope of this feature will be enriched in the future! Fingers crossed 🤞
All by all, it’s a great start and definitely useful to help the generation of descriptions. I personally feel it is not enough yet to solely rely on, but it will give you a head-start!

Pingback: Trying Power BI Copilot to Describe DAX Measures – Curated SQL
good article, Mark. Is there a way to list all of the measures in Fabric semantic model with their formulas and descriptions in a dynamic table?
LikeLike
Hi Ilya,
Are you familiar with Fabric Semantic Link? That’s probably what you’re looking for.
—Marc
LikeLike
Hi Ilia,You can try to use notebooks with semantic link sempy functions, or if you are using the latest Power BI Desktop (October) you may use the new DAX functions, like:INFO.VIEW.TABLES()INFO.VIEW.MEASURES()INFO.VIEW.COLUMNS()INFO.VIEW.RELATIONSHIPS()and create Calculated tables using it.
LikeLike