
It has been a month since my last blog. Busy times with a lot of interesting projects, so less time for writing blogs. Last weekend I was traveling to Power Saturday in Paris. So now I finally had some time to write the blog I was thinking about for a while.
Dataflows!
Power BI dataflows are available for a while now. With dataflows you can run your Power Query logic in the Power BI service to generate data marts before you load them to your Power BI datamodel. One of the advantages of dataflows is to isolate datasets from different sources. A really useful feature since your complete datamodel refresh will fail when there is an error in processing your dataset.
Isolating your data sources by creating a dataflow for each data source, possible issues will appear in your dataflow and not in your dataset. At the moment that one of the dataflows failed to refresh, your datamodel will still be processed successfully because dataflows will always keep your last successfully processed table in memory.
Find out more about dataflows in the documentation here.
Last successful refresh
Knowing what you can do with dataflows, you might want to know when your dataflow failed to refresh. This is something which you can see on workspace level in the Power BI service of course.

But maybe you want to visualize this as part of your report as well. With a really simple piece of Power Query code you can easily generate a date/time at the moment that your dataset is processed. Kasper de Jonge wrote a blog post on that, so I’m not going to elaborate on that. However, when we add this as a separate entity to each dataflow, it results in a last successful refresh date/time for each dataflows.
Since each dataflow will be refreshed on it’s own, likewise as a dataset, the entity with your last date/time will always the last date/time for the whole dataflow, no matter how many entities are in there.
Combine refresh times of all your dataflows
In the previous part, I explained about adding a refresh date/time as an entity to each dataflow. Each entity needs to have a reasonable name of course. I always prefer to give all my refresh date/time entities the same name. Simply because in the next steps we’re going to need this to group all our date/times for all our dataflows together.
In order to get one overview of all your refresh date/times, we’re going to create one table with all our refresh date/time entities grouped together. You can do this by following the below steps:
- In Power BI desktop go to Edit Queries
- Create a parameter with the name DataflowLastRefreshEntityName which we will use later on to filter the entities on for getting all our last refresh dates and times
- Make sure you have the parameter type to text and add the name you used for your last refresh date/time entities.
- In the ribbon click on Get Data and pick Blank Query.
- Paste the below Power Query code in the blank query which will generate a list of all your dataflows and entities including the pre-set entity name which you defined in the parameter.
let
     Source = PowerBI.Dataflows(null),
     #"Expanded dataflow details" = Table.ExpandTableColumn(Source, "Data", {"dataflowId", "dataflowName", "dataflowDescription", "Data"}, {"dataflowId", "dataflowName", "dataflowDescription", "Data.1"}),
     #"Expanded entity details" = Table.ExpandTableColumn(#"Expanded dataflow details", "Data.1", {"entity", "Data"}, {"entity", "Data"}),
     #"Removed Columns" = Table.RemoveColumns(#"Expanded entity details",{"ItemKind", "ItemName", "IsLeaf"}),
     #"Filtered entities on parameter" = Table.SelectRows(#"Removed Columns", each Text.Contains([entity], (DataflowLastRefreshEntityName)))
in
     #"Filtered entities on parameter"
- After you have done all the above steps, you should be able to expand the Data column with which you can expand all the details about the last refresh date/time for all your dataflows. The exact result of this step depends on the columns you created in the entities for your last refresh date/time.
After applying the above steps, you can close and apply the query editor window. This will load the before generated table with all the last refresh dates and times of your dataflows. Now, you can visualize this in a table to your end users to show them if their refresh was successful and if they are looking at the latest set of data.
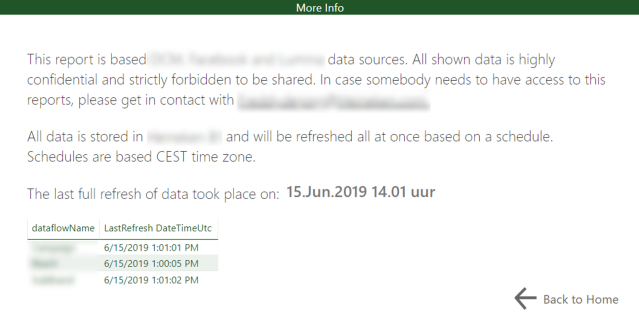
Shown below an example of what I’ve added to one of my recently created reports as an pop-up with bookmarks to inform the end-users about the last refresh dates.

Pingback: Embedding Refresh Times in Power BI Reports – Curated SQL
Hello, Thank you for the post, since you’re addressing an issue that I’m trying to solve. I have a Power BI model that is sourced from a Power BI dataflow. However, I’m still unable to see the “meta” last refresh timestamp for the Power BI dataflow after following your steps. I just get the actual data fields from the entity that is included in the dataflow. Do you know if it’s possible to add a timestamp to the Power BI dataflow entity OR reference the LastRefresh timestamp from the dataflow in the Power BI model?
Thanks,
Ben
LikeLike
the code above does not seem to return anything – maybe it’s the entity filter – what should i put there?
LikeLike
Hi Hans,
I’m not sure if I fully understand your challenge. First thing you need to do is include an entity in every dataflow that returns the DateTime of the refresh. You can do this with Power Query DateTime.LocalNow(). The second part is used to capture all these refresh times in one table in your data model, in order to have one table including the last refresh datetime of every dataflow that you pull in your data model. That will return you the result as displayed in the table (screenshot) above.
Hope this helps,
Marc
LikeLike
How are you able to place the refresh DateTime INSIDE the text box?
LikeLike
It simply combines a text box with a card visual. So actually there are two Visuals.
Another option could be to concatenate all the text in one string, using DAX, but I believe that overcomplifies it.
Cheers,
Marc
LikeLike
Thanks, Marc! Yes, I had found the concatenation approach elsewhere but was significantly overcomplicating the process, as you mentioned. I also found the Card/Text Box approach, but how do you work them together with a button so the card doesn’t show? Am I to understand that showing or hiding a card is also possible with bookmarks?
LikeLike
Yes, you can use bookmarks to show/hide objects on the report canvas. If you want to show/hide multiple objects at a time, use the grouping functionality.
LikeLike
Hi, thanks for code provided, but it seems it doesn’t get the Datetime refresh or lastupdate timestamp.
LikeLike
Every time you refresh the dataflow, the Power Query expression will be re-evaluated. Please check again if you applied exactly the steps as described. Everything works on my end.
–Marc
LikeLike
Hello Marc, thanks for the post!
In order to accomplish all the steps , I must be the dataflow owner , isn´t it? Otherwise I am not able to create the entity you mention in dataflow…with only access to Power Query in PBI Desktop it is not possible…only to confirm. Thanks again
LikeLike
Hi,
Yes that’s correct. This entity must be added in the dataflow itself, so you must be owner to perform this change.
–Marc
LikeLike